
C (Citigroup) has plunged 12% over the past 2 trading sessions & has impulsively taken out the 49.41 support with no signs of reversing or even slowing at this time.
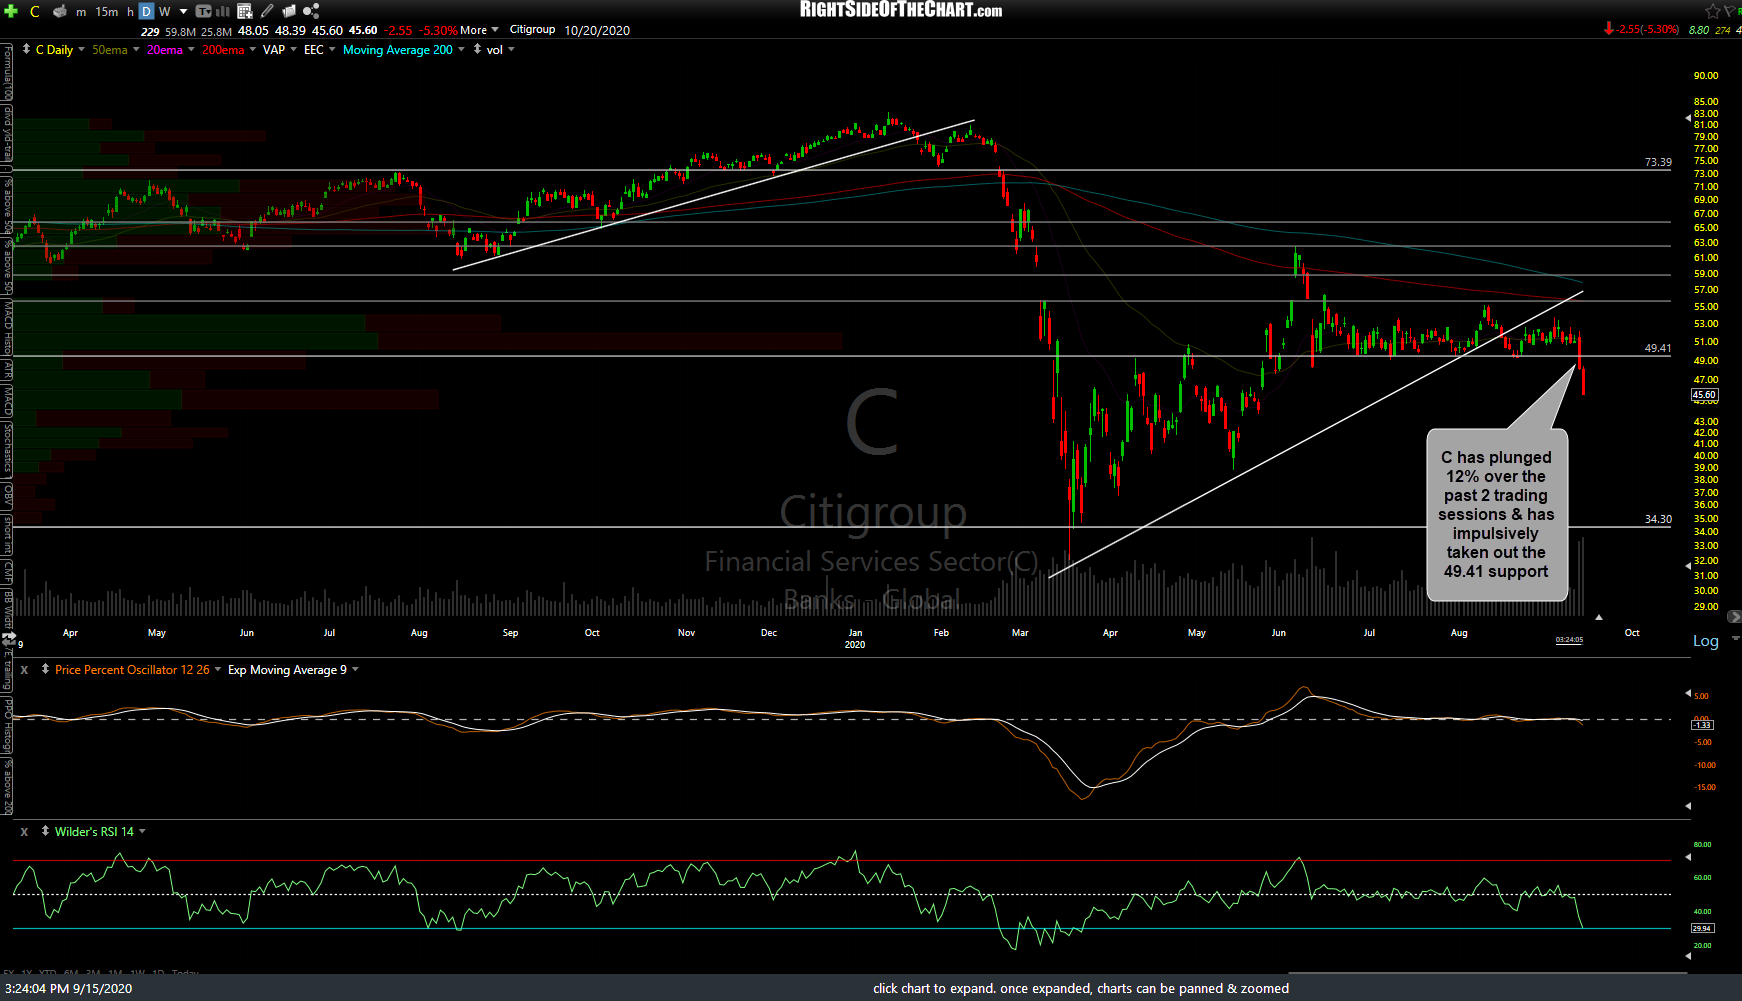
C daily Sept 15th
JPM (JP Morgan Chase) is pinching towards the apex of this symmetrical triangle with a solid break above or below likely to determine the next tradable trend.

JPM daily Sept 15th
BAC (Bank Of America Corp) is flirting with uptrend line + 25.20 support with a solid break below likely to trigger a wave of selling.
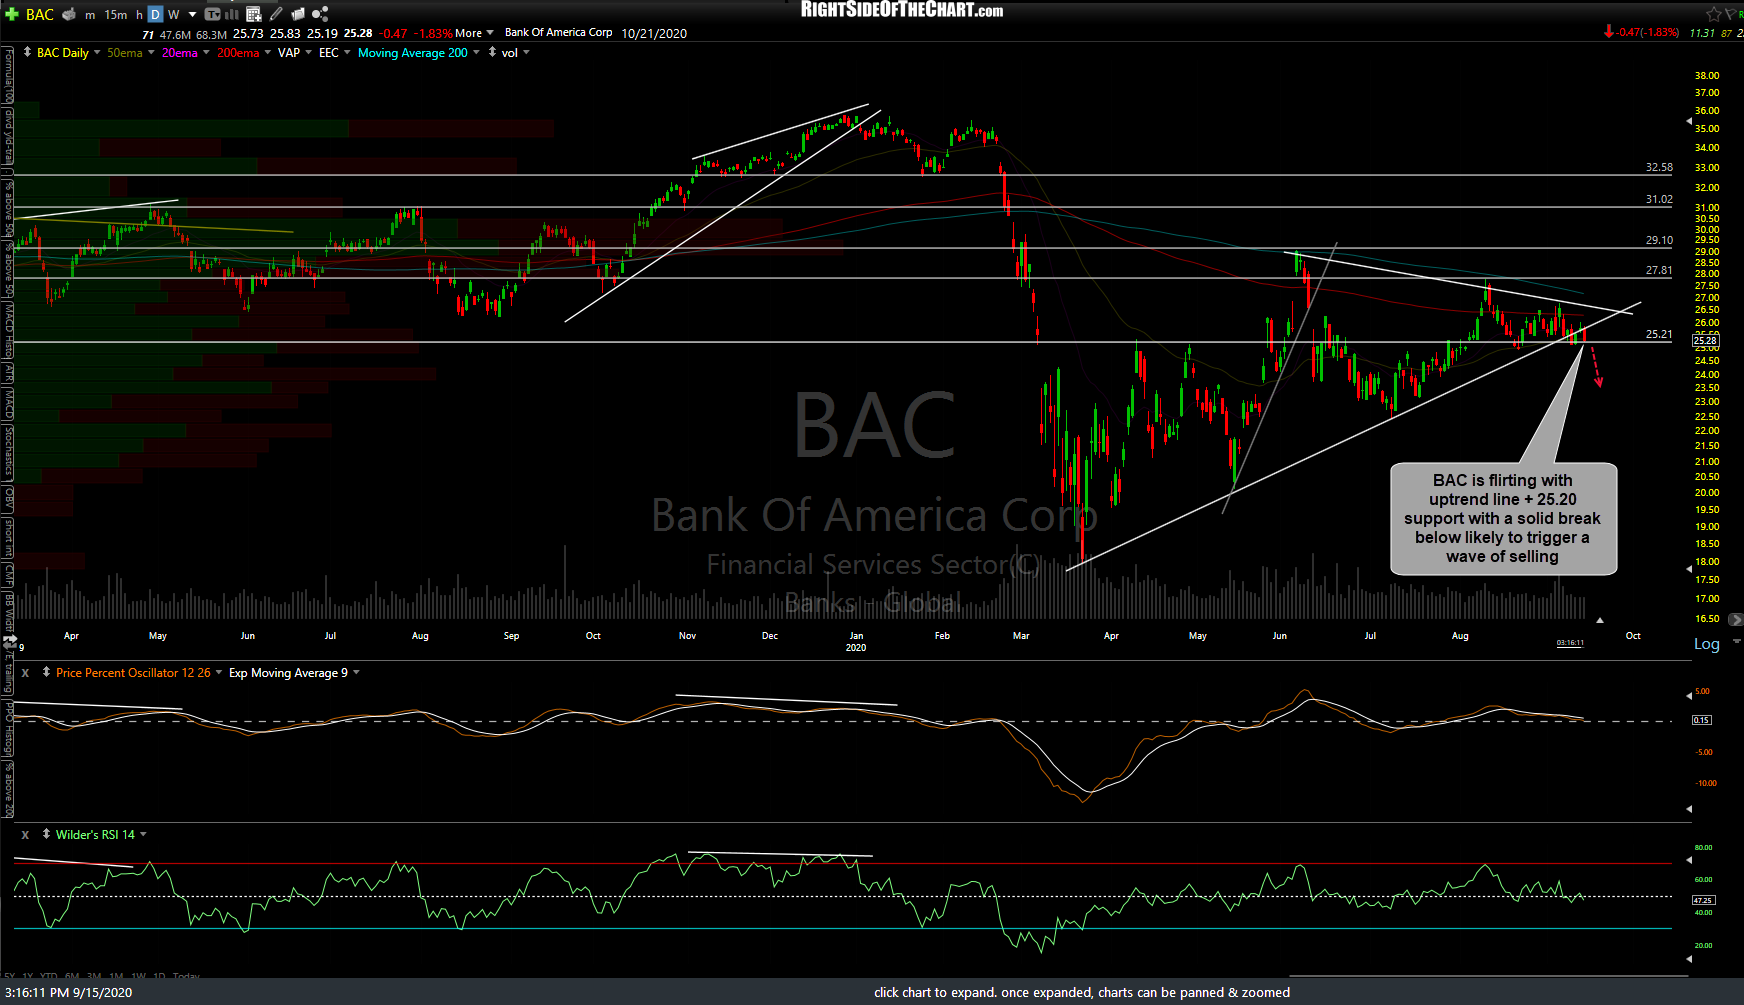
BAC daily Sept 15th
$BKX (the KBW Bank Sector Index) is pinching towards the apex of this symmetrical triangle pattern with a solid break above or below likely to determine the direction of the next trend.
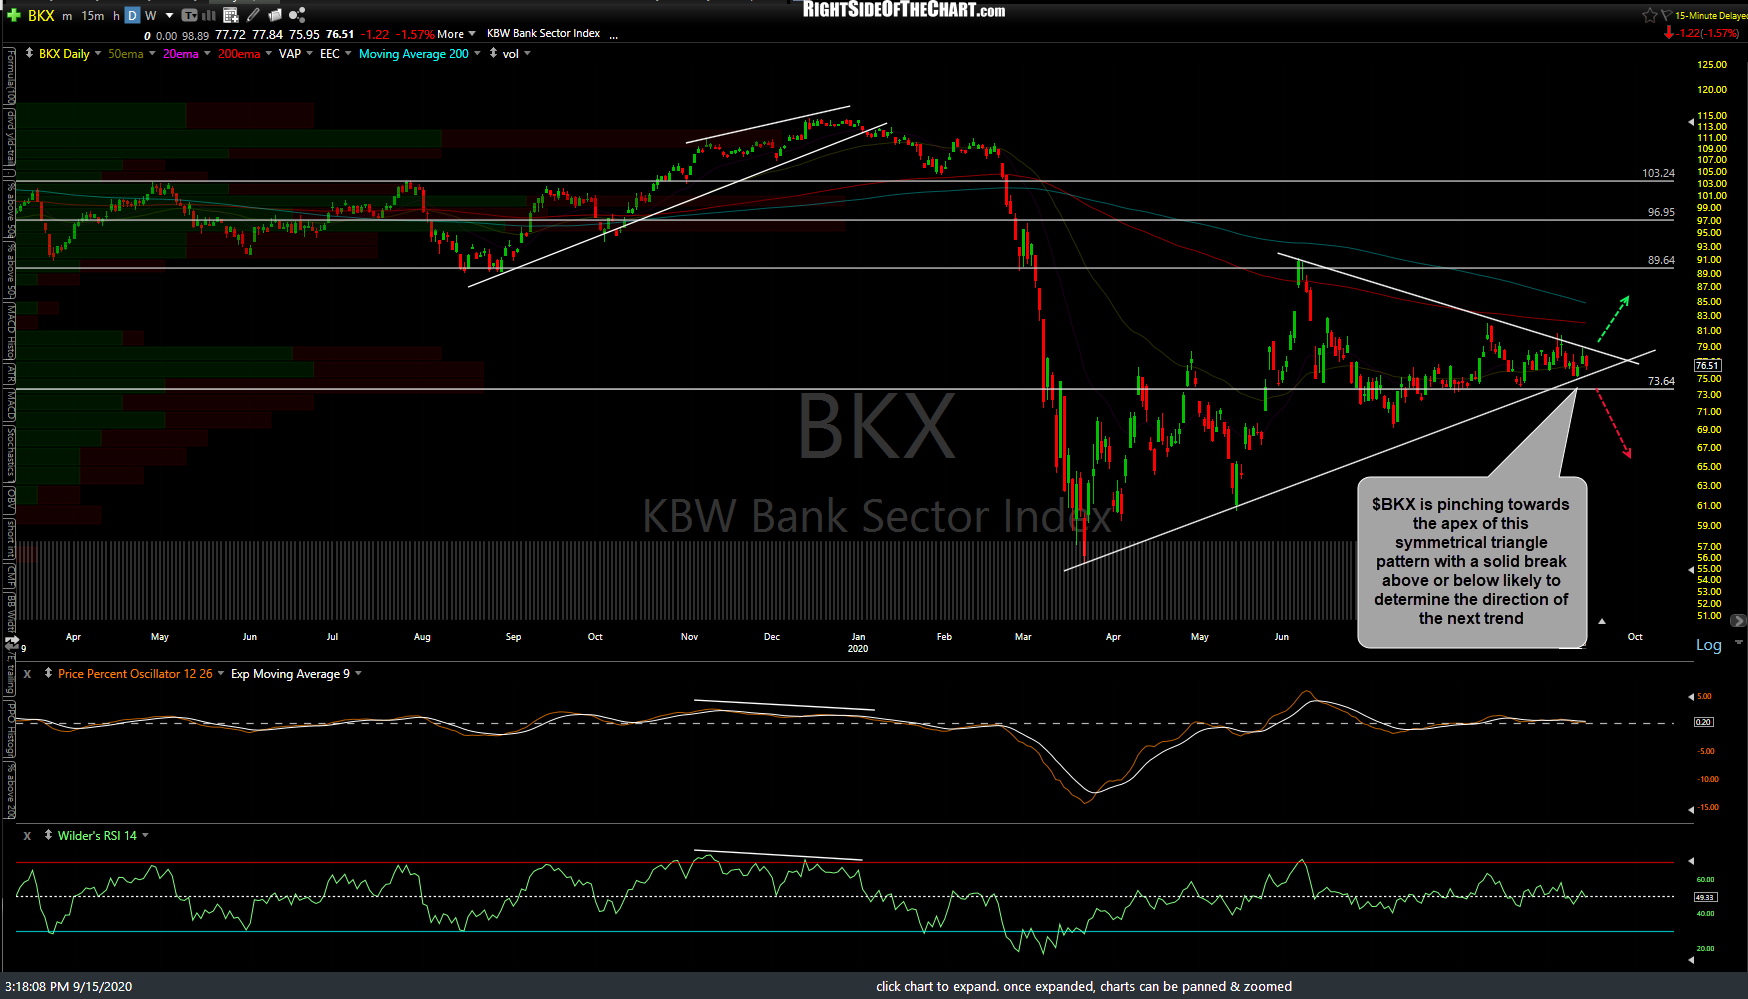
$BKX daily Sept 15th
Not a great sign for the financial system & stock market when the world’s largest banks have been trading flat for months, well off their multi-year bull market highs from late 2019/early 2020 during one of the strongest new mortgage & refinancing booms. I’d hate to see how the market starts pricing these stocks if the housing market starts to cool down. Regardless, the charts of these mega-TBTF (too big to fail) banks certainly aren’t looking so hot right now. Something worth monitoring going forward as increasing concerns about the TBTF banks would likely have ripple effects through other sectors in the stock market.