
The $SPX is currently poised to gap down towards my next target area around the 1910/11 area (this chart was made in pre-market & is reflective of Wednesday’s close). Notice how well prices have acted off the support levels that were first posted on this $SPX 60-minute chart, as well as all the other 60-minute index & index tracking ETF charts posted last week, with price bouncing on or around those levels & turning back down when those levels were backtested from below on Wednesday’s short-lived rally.
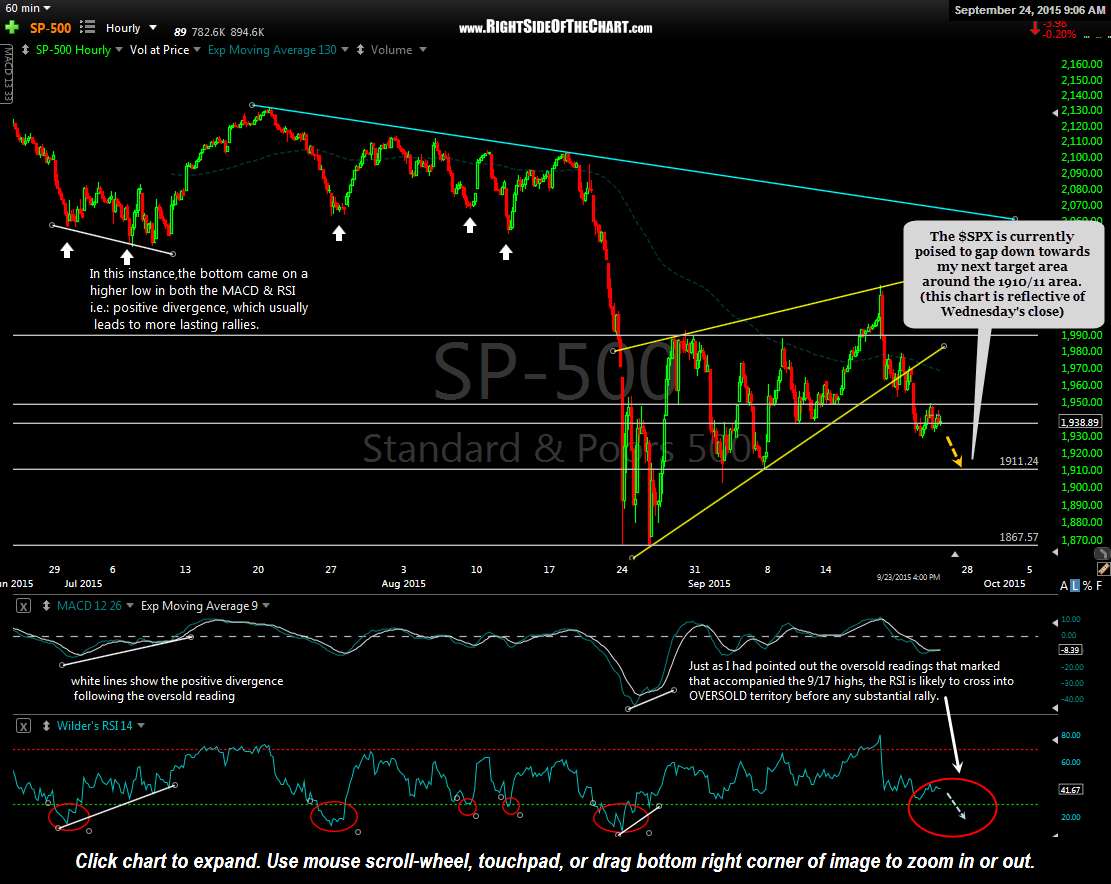
$SPX 60 minute Sept 24th
As with any price target, the odds of a reaction on the initial tag are elevated but as I’ve been preoccupied with adding some new features & improvement to the site lately, I remain in swing trade mode, not interested in daytrading any of the minor rips & dips at this time. However, I will be on the lookout to possibly reduce some short exposure soon, possibly as soon as today. Just as I had pointed out (in this post) the overbought readings that accompanied the Sept 17th highs (which was the last tag of the top of this rising wedge pattern), along with highlighting how similar overbought readings in the past were followed by corrections or a new leg down, the inverse to that holds true as well. As shown on this chart, tradeable rallies usually follow oversold readings (30 or below on the RSI). As the $SPX is now getting close, we may see the 60-minute RSI cross below 30 while the $SPX hits this next downside level. As such, it might be prudent to book some profits or at least tighten stops on any shorts. I’ll post some follow-up comments during the trading session today.