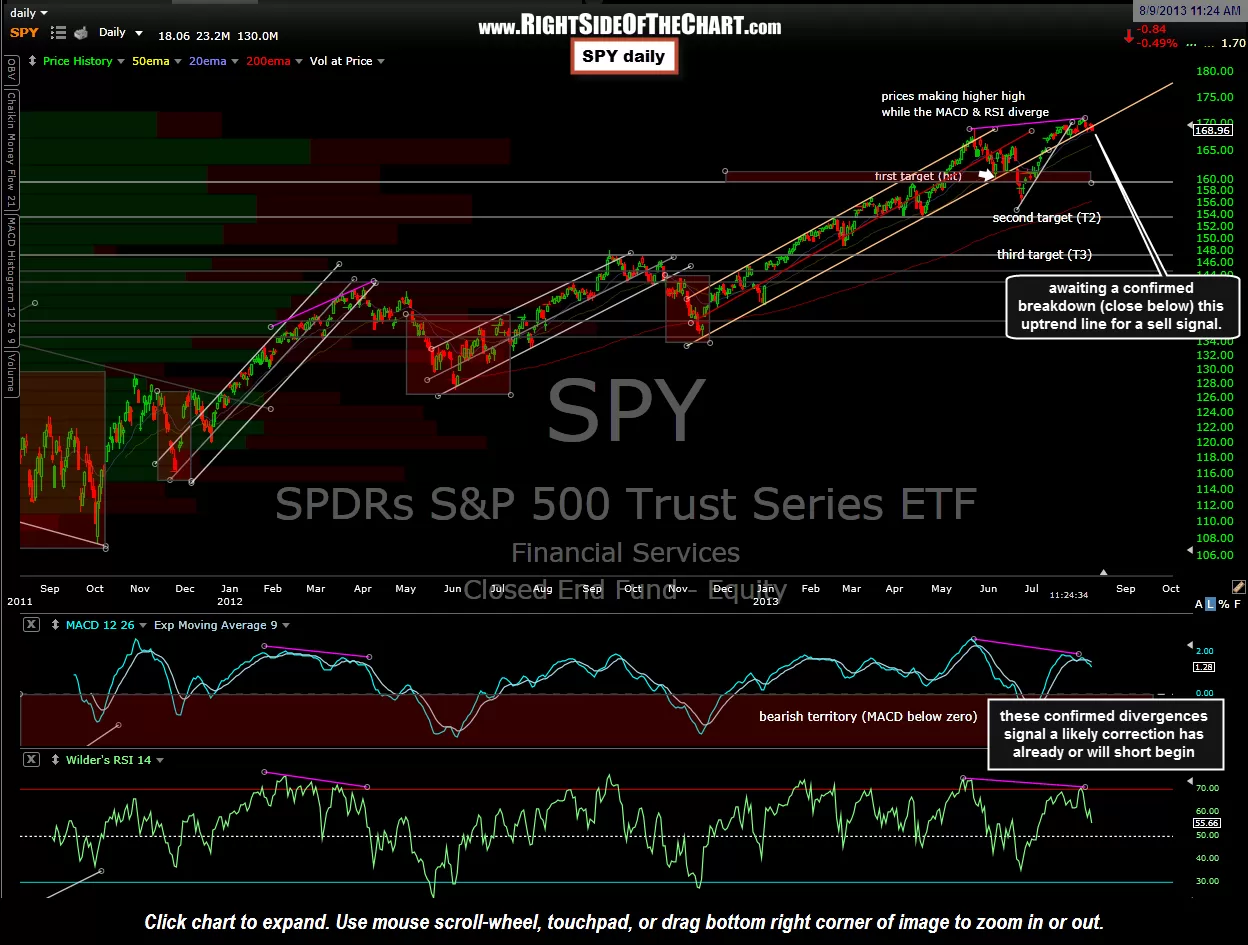
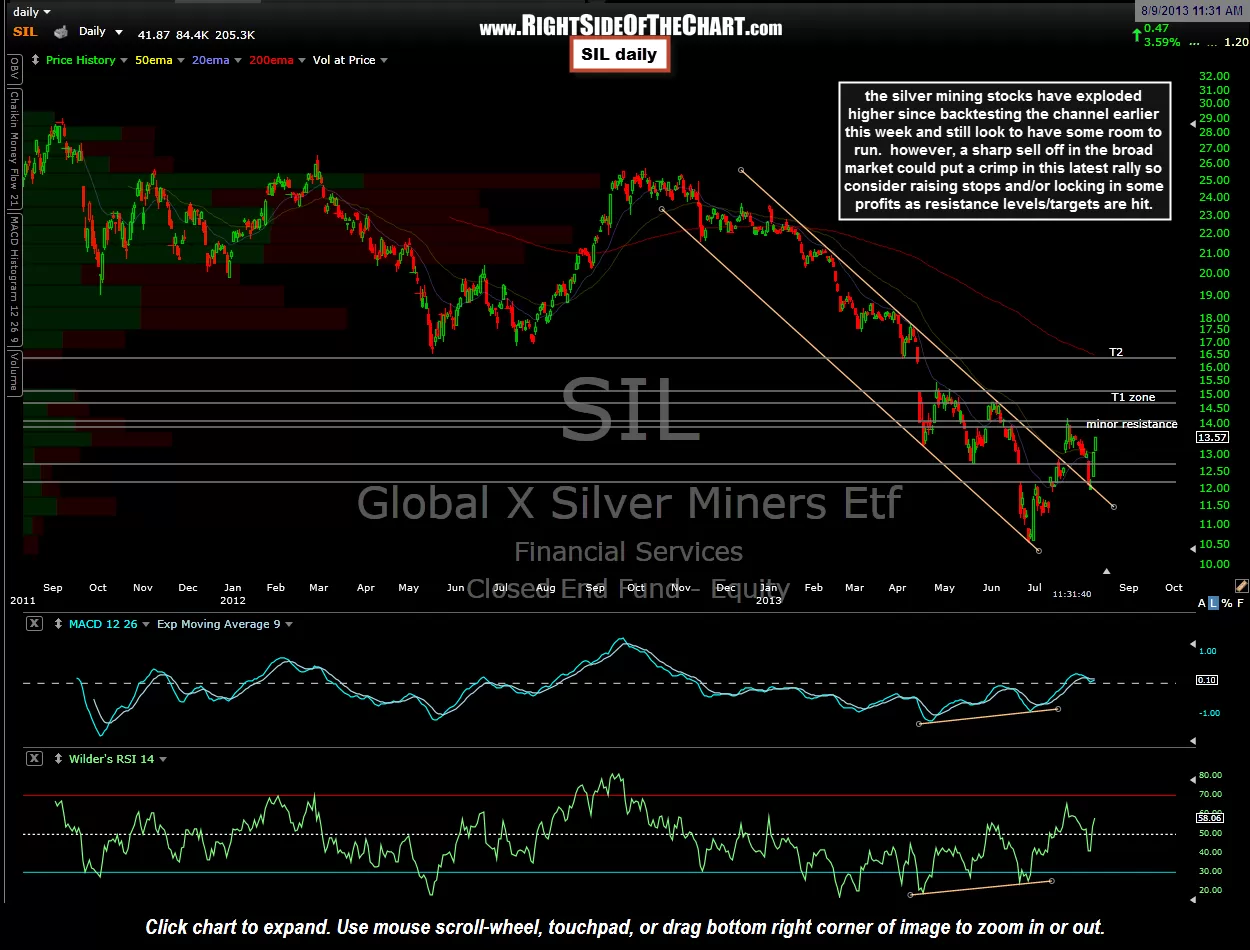
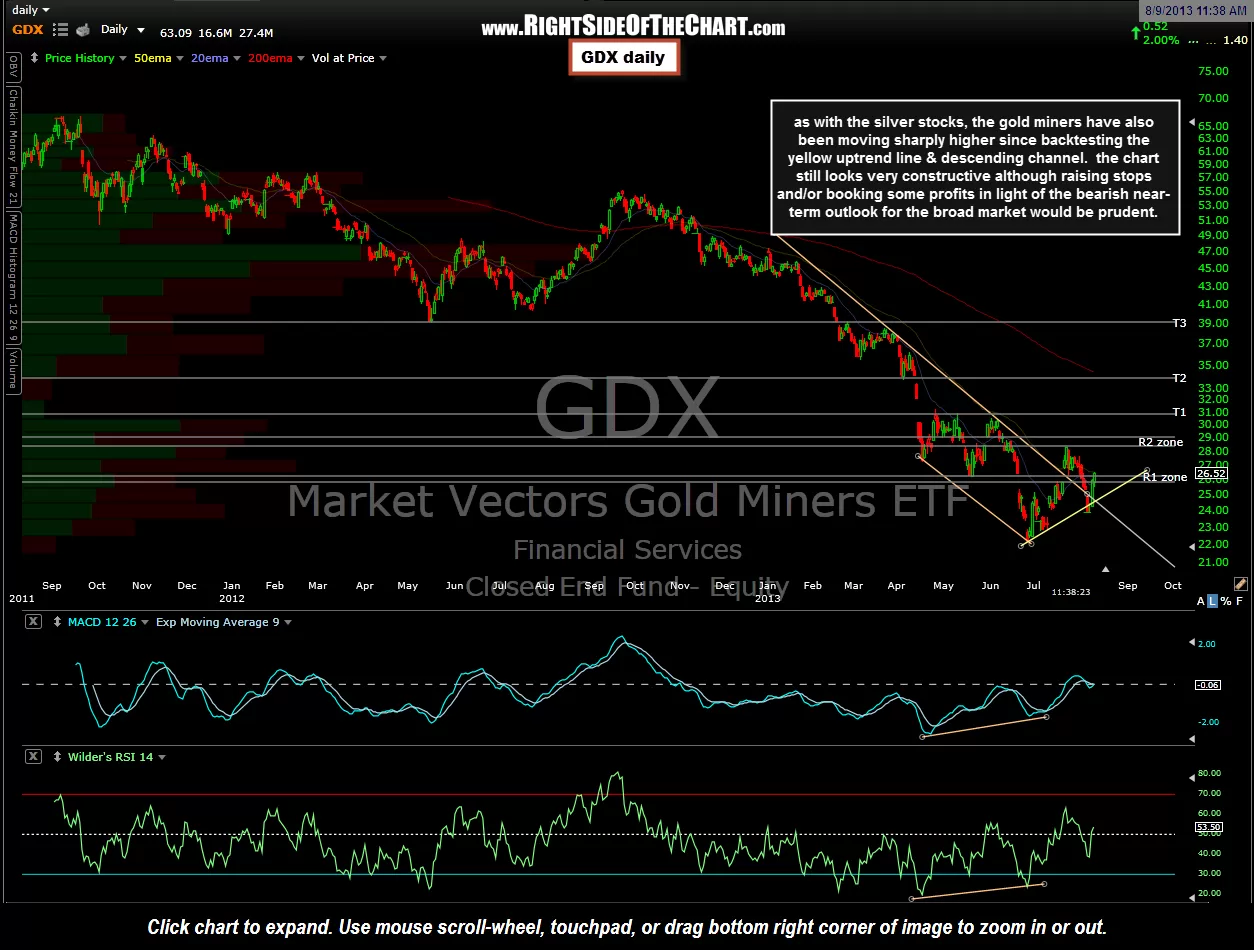
My current positioning is really pretty simple: Long metals & miners, short equities. That’s generally speaking as I do own select longs other than mining stocks but overall, I favor a net short bias on equities with a net long exposure to gold & silver stocks. However, keep in mind that there are quite a few ingredients in place right now, that given the proper catalyst, could lead to a sharp broad-based sell-off in equities that could bleed over to the mining sector if things were to get ugly. As such, although I think the mining stocks still look bullish, I’m starting to reduce exposure once again, just a fews days after adding back most of the exposure that I took off back when the GLD peaked on July 23rd.
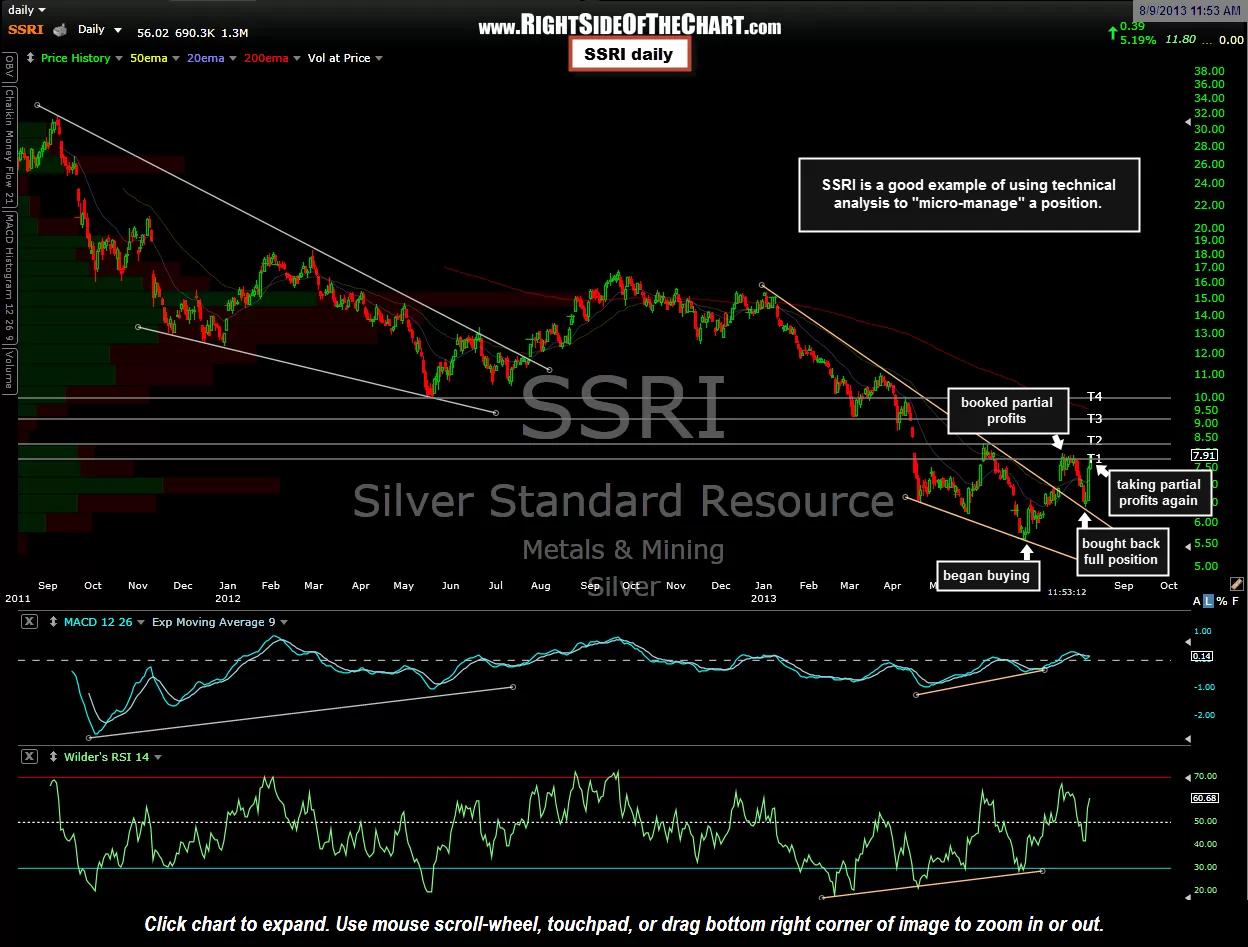
SSRI illustrates how using the charts to micro-manage a trade can considerably enhance your returns. Listed below are the updated daily charts of SPY, SIL, GDX, & SSRI. SSRI gives a nice visual of how that trade has played out so far. I started buying SSRI on June 26th when it was posted as one of my favorite picks in the mining sector, then posted booking partial profits on SSRI, along with most of my other gold & silver miners, just as the rally had peaked, and then just recently brought SSRI back to a full position on the backtest of the bullish falling wedge after my pullback targets in the metals (GLD & SIL) were hit. They don’t always work out this well but this chart does a good job of illustrating the concept of micro-managing a trade around the key support & resistance levels (including price targets) shown on the charts posted on RSOTC.