
Not much new to report on the broad market as the S&P 500 is now in the fourth consecutive week of testing the 282ish key resistance level. While trading slightly above that level now, I’m watching/waiting to see if SPY can print a solid weekly close above the key resistance as well as a solid weekly cross/close of the PPO 9-ema back above the zero line to flip that trend indicator from bearish to bullish.
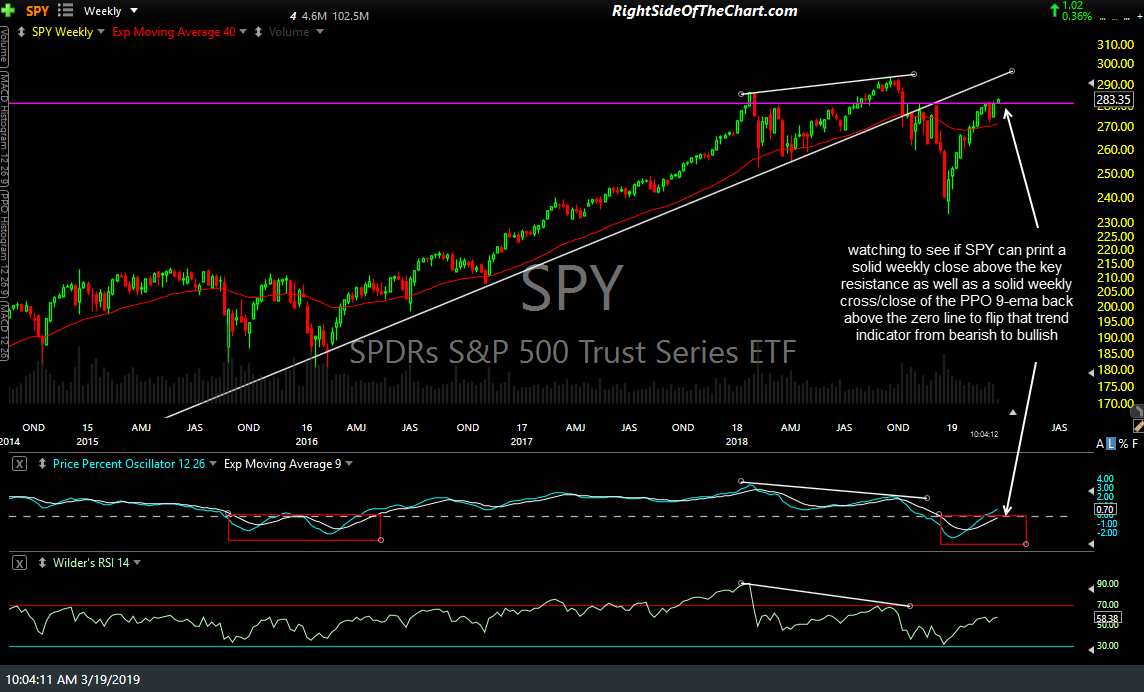
SPY weekly March 19th
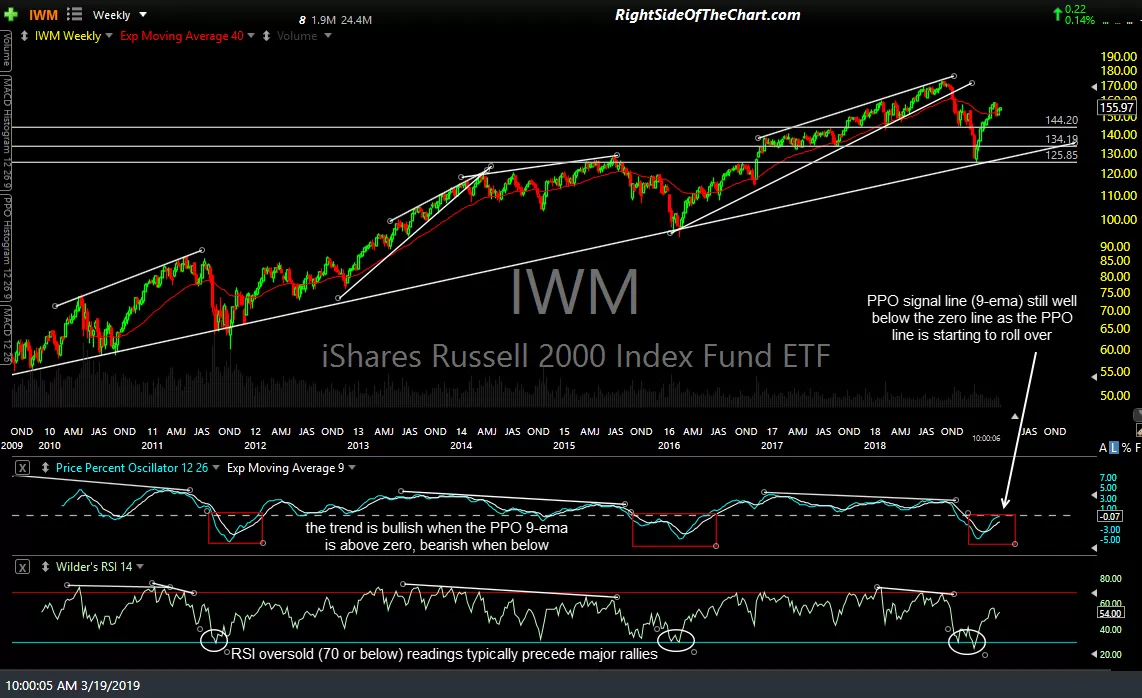
At the other end of the market cap spectrum, the PPO signal line (9-ema) on the IWM weekly chart is still well below the zero line as the PPO line is starting to roll over. Should SPY clearly put the 282ish resistance level in the rear view mirror in the coming days & weeks, that would most likely add a tailwind to the small cap stocks & could determine which way IWM breaks on the 60-minute chart.
-
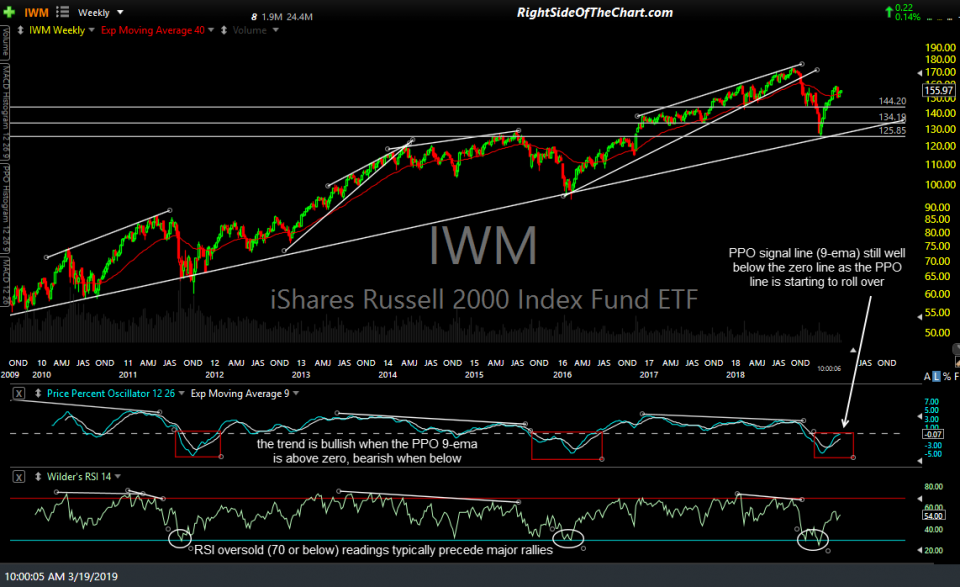
- IWM weekly March 19th
-
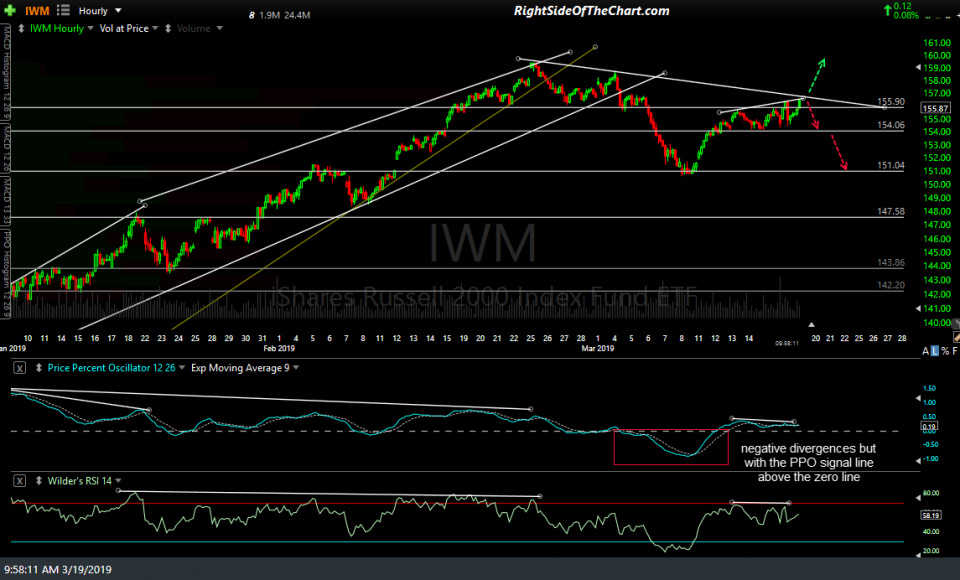
- IWM 60-min March 19th
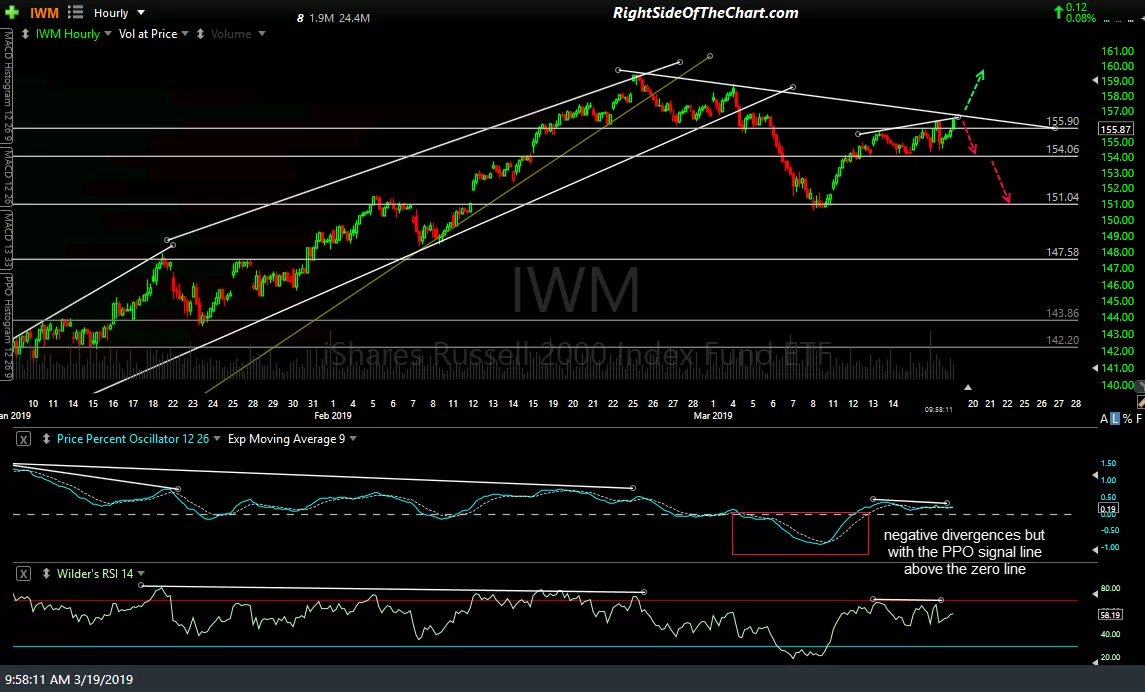
We’ve seen SPY make several intraweek pops above that key resistance over the last 3-weeks as well as a very impulsive rejection off that level. Will this be another ‘hurry up & wait’ week or will SPY finally start to move impulsively away from this level, one way or the other? Most likely sooner than later the market will pick a direction but be careful of reading too much into the intraday & even the intraweek price swings, especially with the unusually low volume that we’ve seen so far this week.