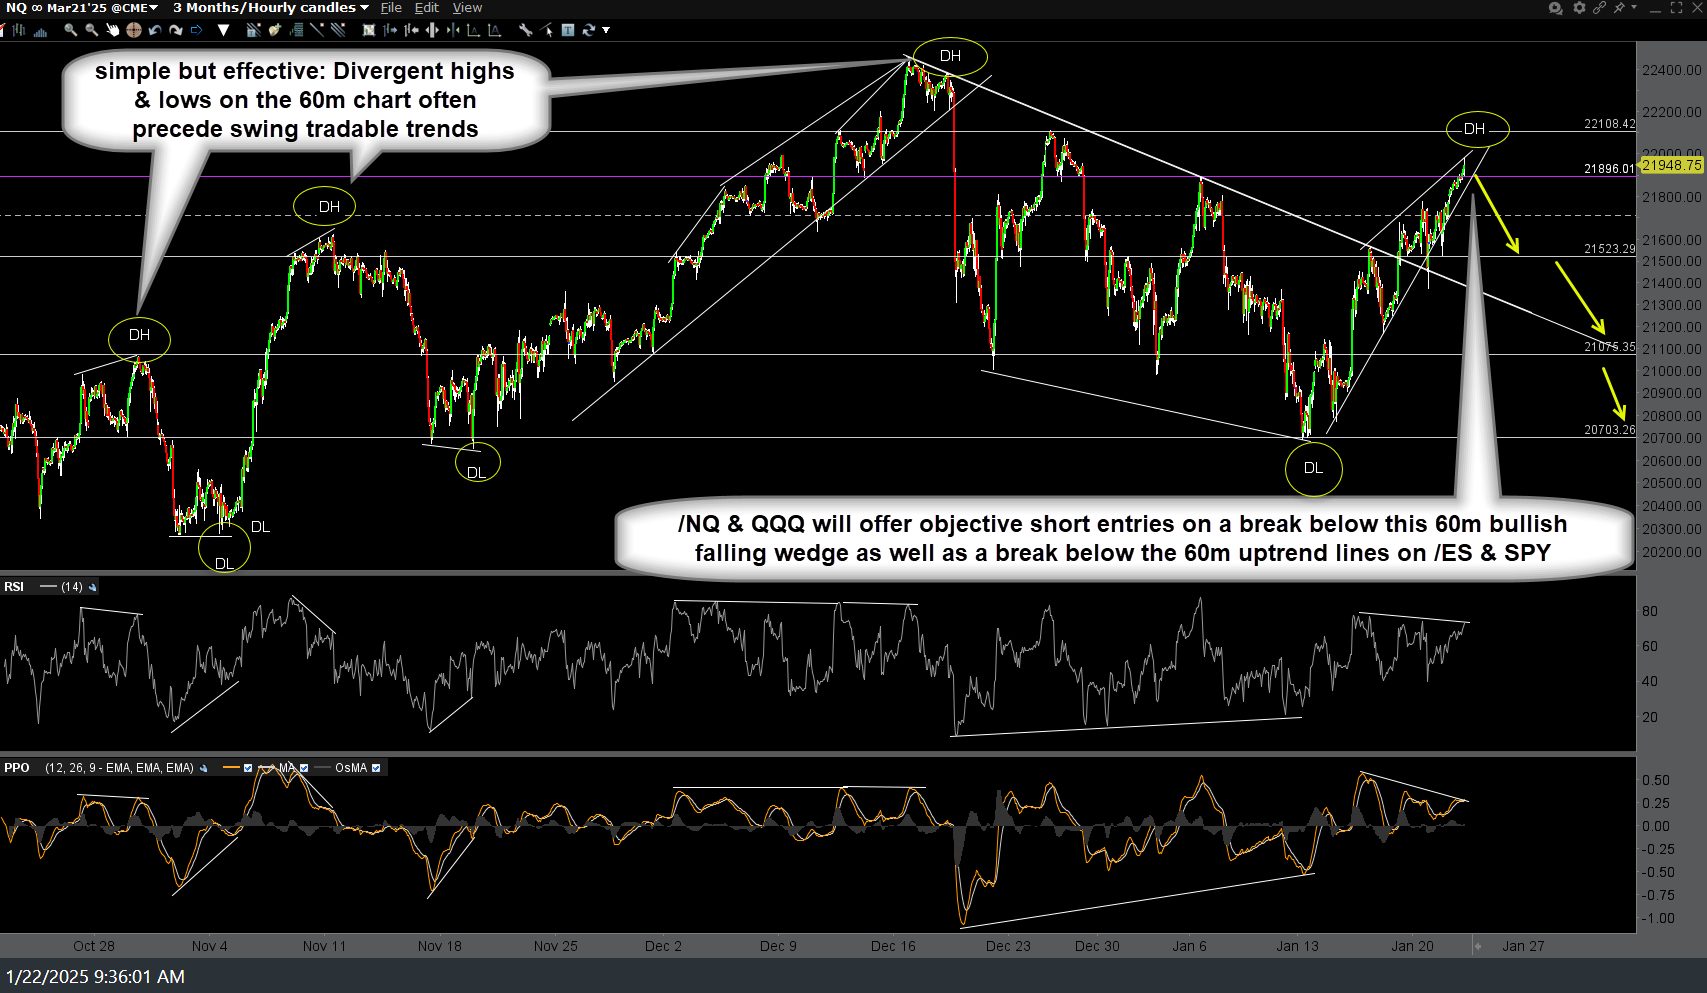
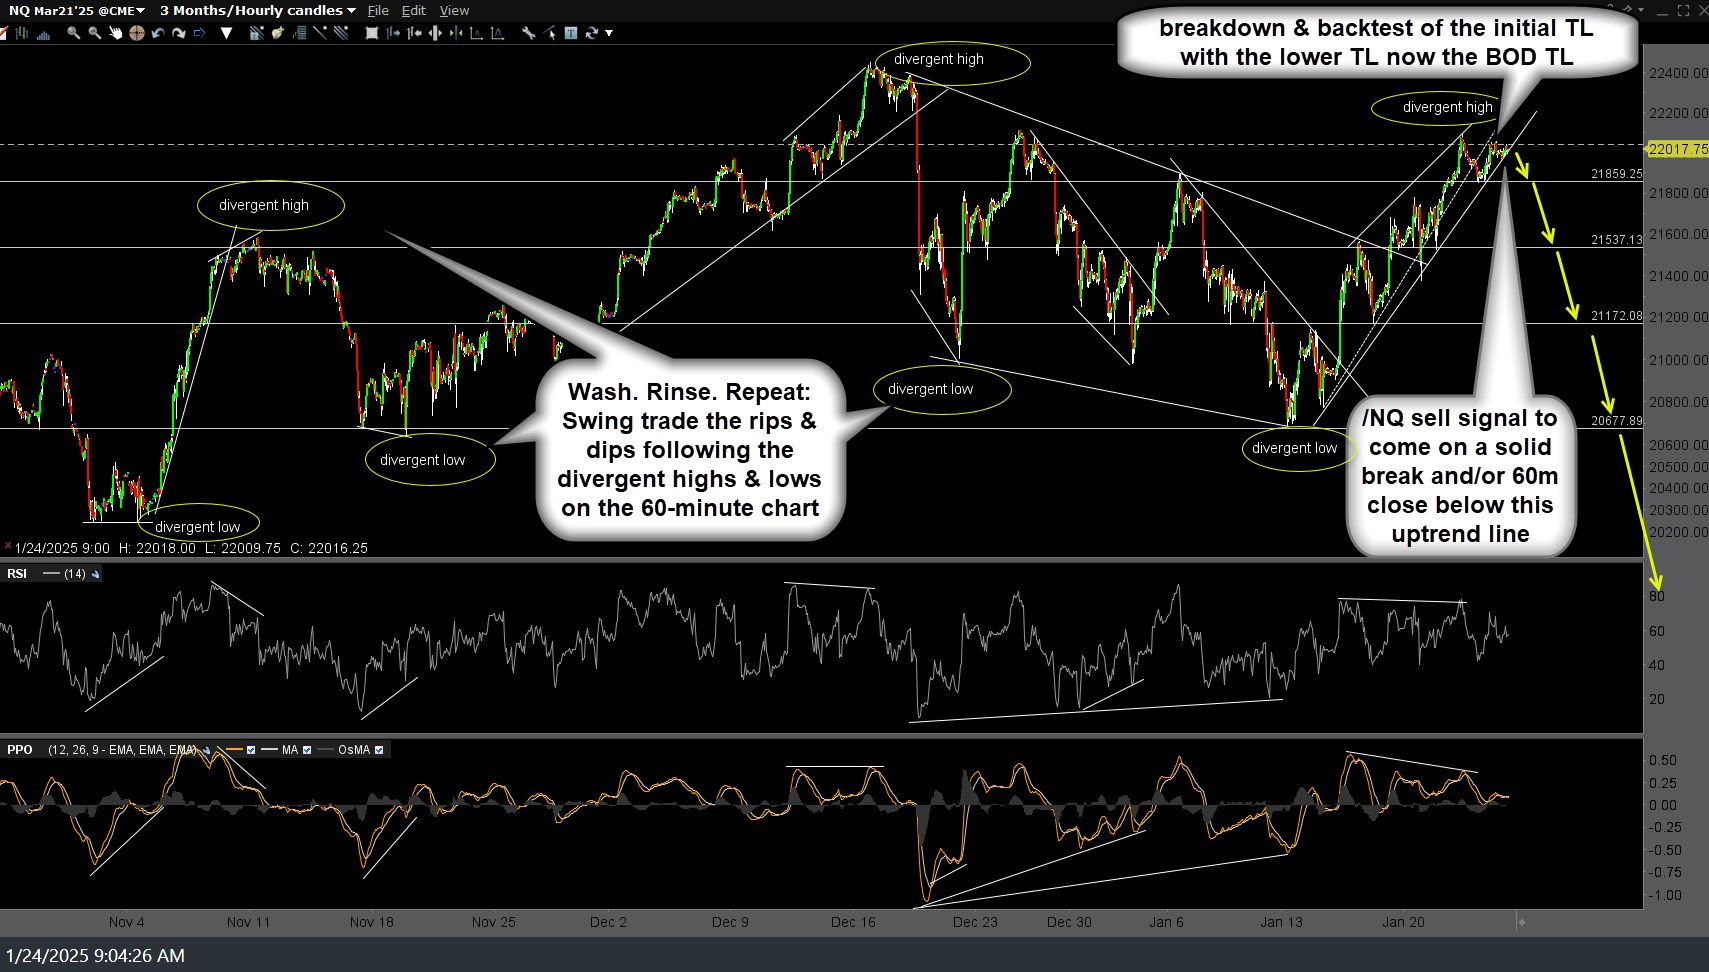
/NQ (Nasdaq 100 futures broke down below & backtested of the initial minor uptrend line with that lower trendline now the what I refer to as the BOD (befefit-of-the-doubt) trendline with the next sell signal to come on a solid break and/or 60-minute close below it. Previous & updated 60-minute charts below.
Remember, as recently highlighted, the lead sled dog, AAPL, recently fell to its key 200-day moving average where the odds were very to extremely high that the buyers would step in for at least a bounce. So far that has been the case so whether or not the Nasdaq 100 will break down & go on to hit any or all of the potential targets on the chart above depends largely on whether or not AAPL continues to rally of its 200-day MA or if it goes on to make a solid & sustained break below it.
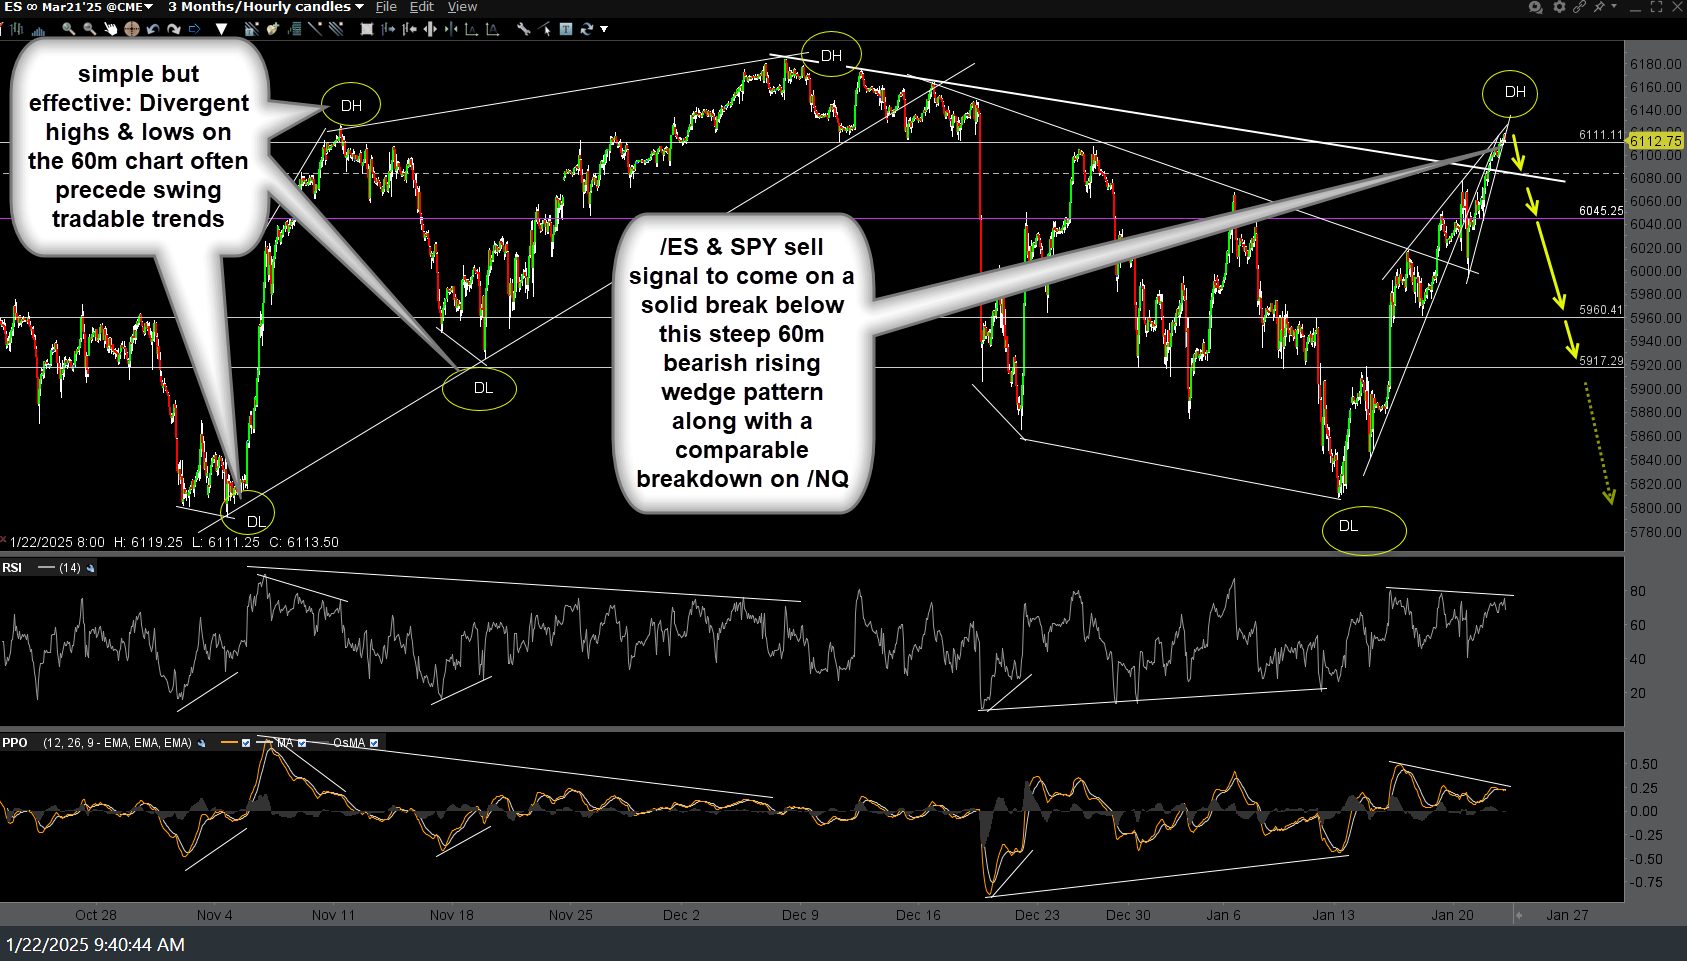
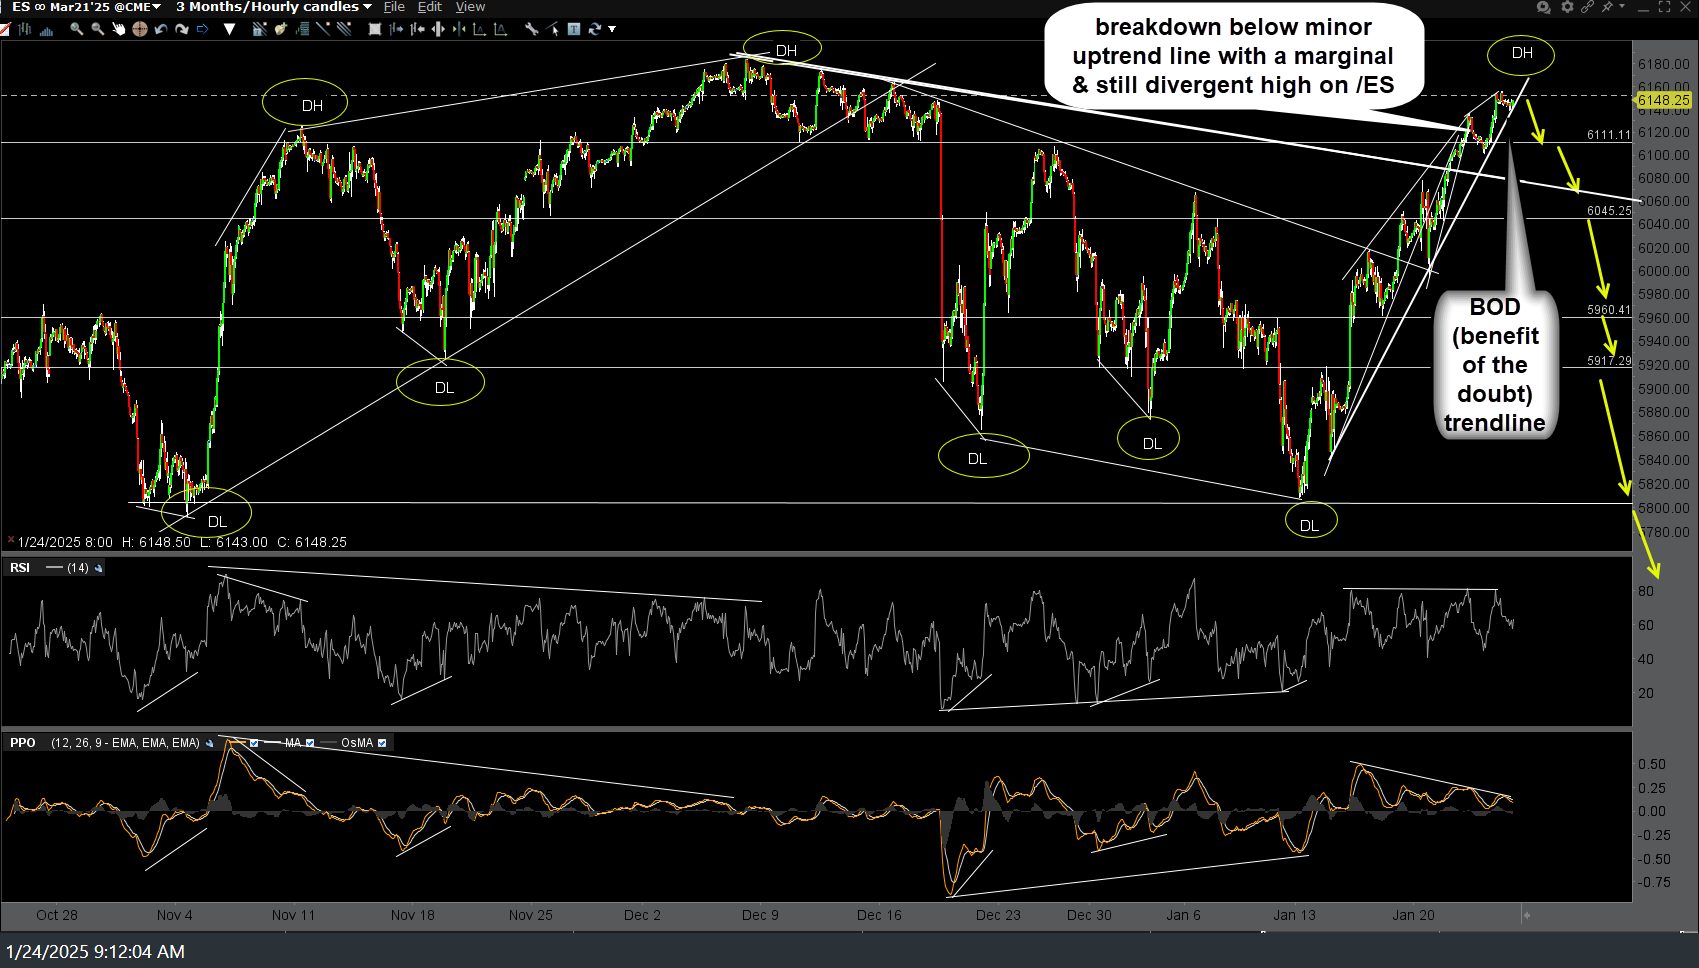
/ES (S&P 500 futures) broke below the recently highlighted minor uptrend line & as with /NQ, I’ve since added a larger, more significant (BOD) uptrend line with the next sell signal on /ES or SPY to come on a solid break and/or 60-minute close below it (along with a comparable breakdown on /NQ). Previous & updated 60-minute charts below. Ditto for that whole AAPL thing as Apple is also the largest component of the S&P 500, or was until a few days ago when NVDA ever-so-slighted leap frogged it.
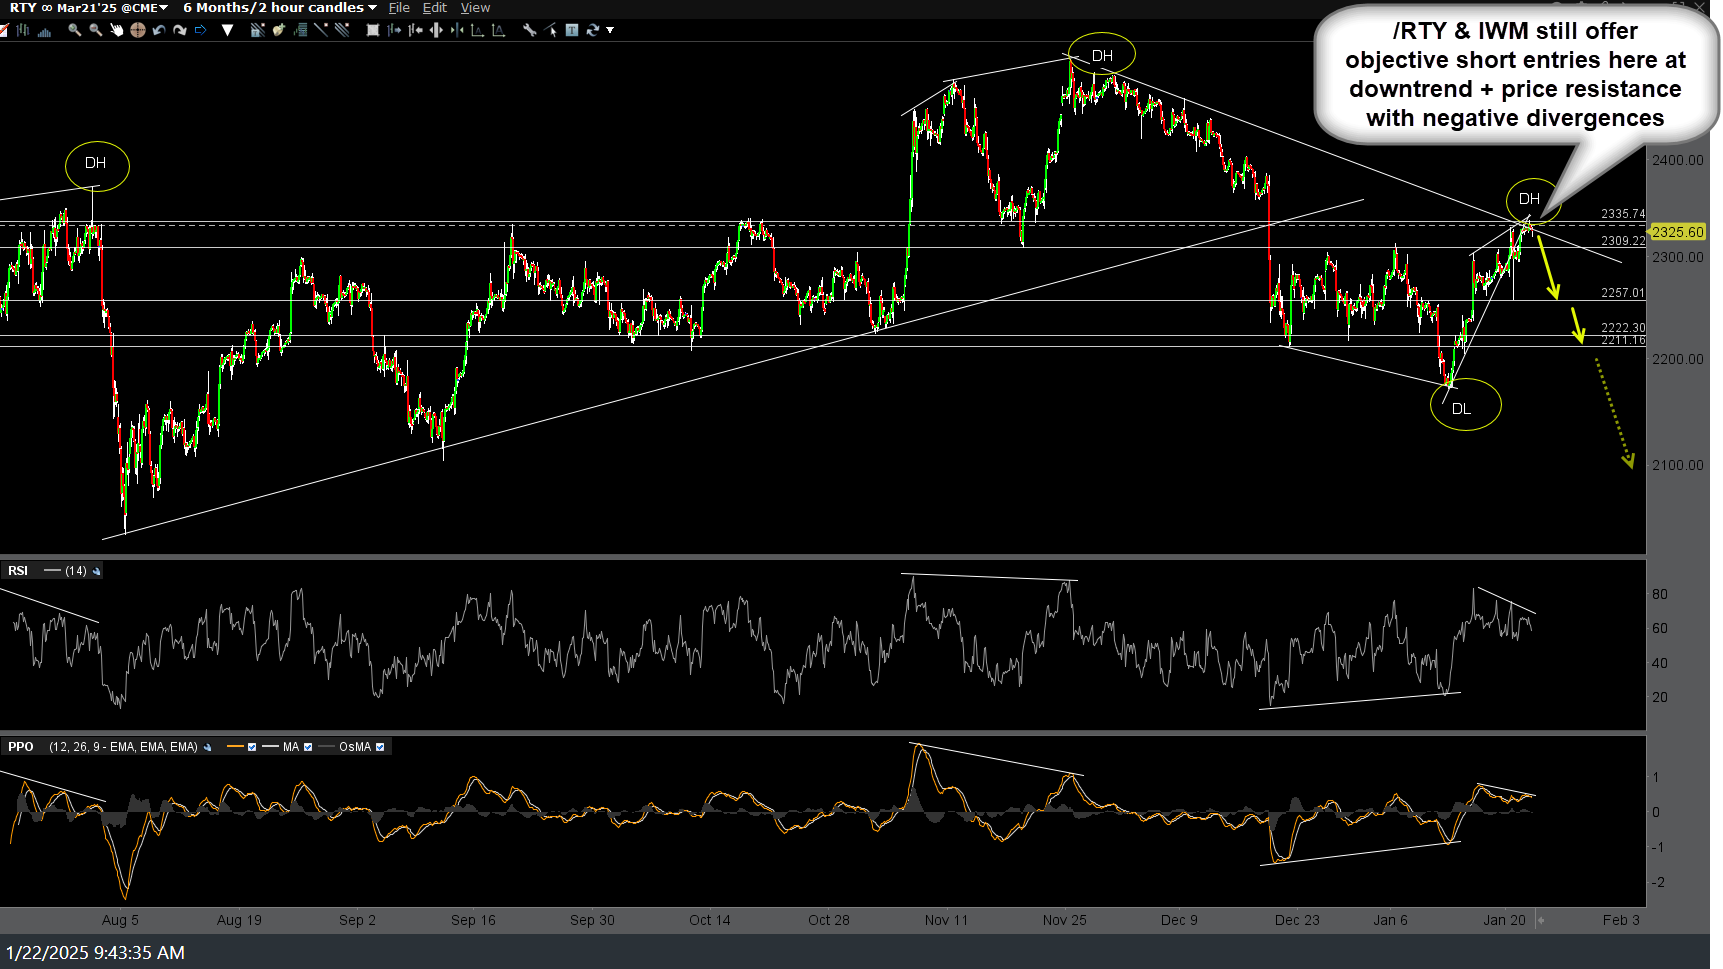
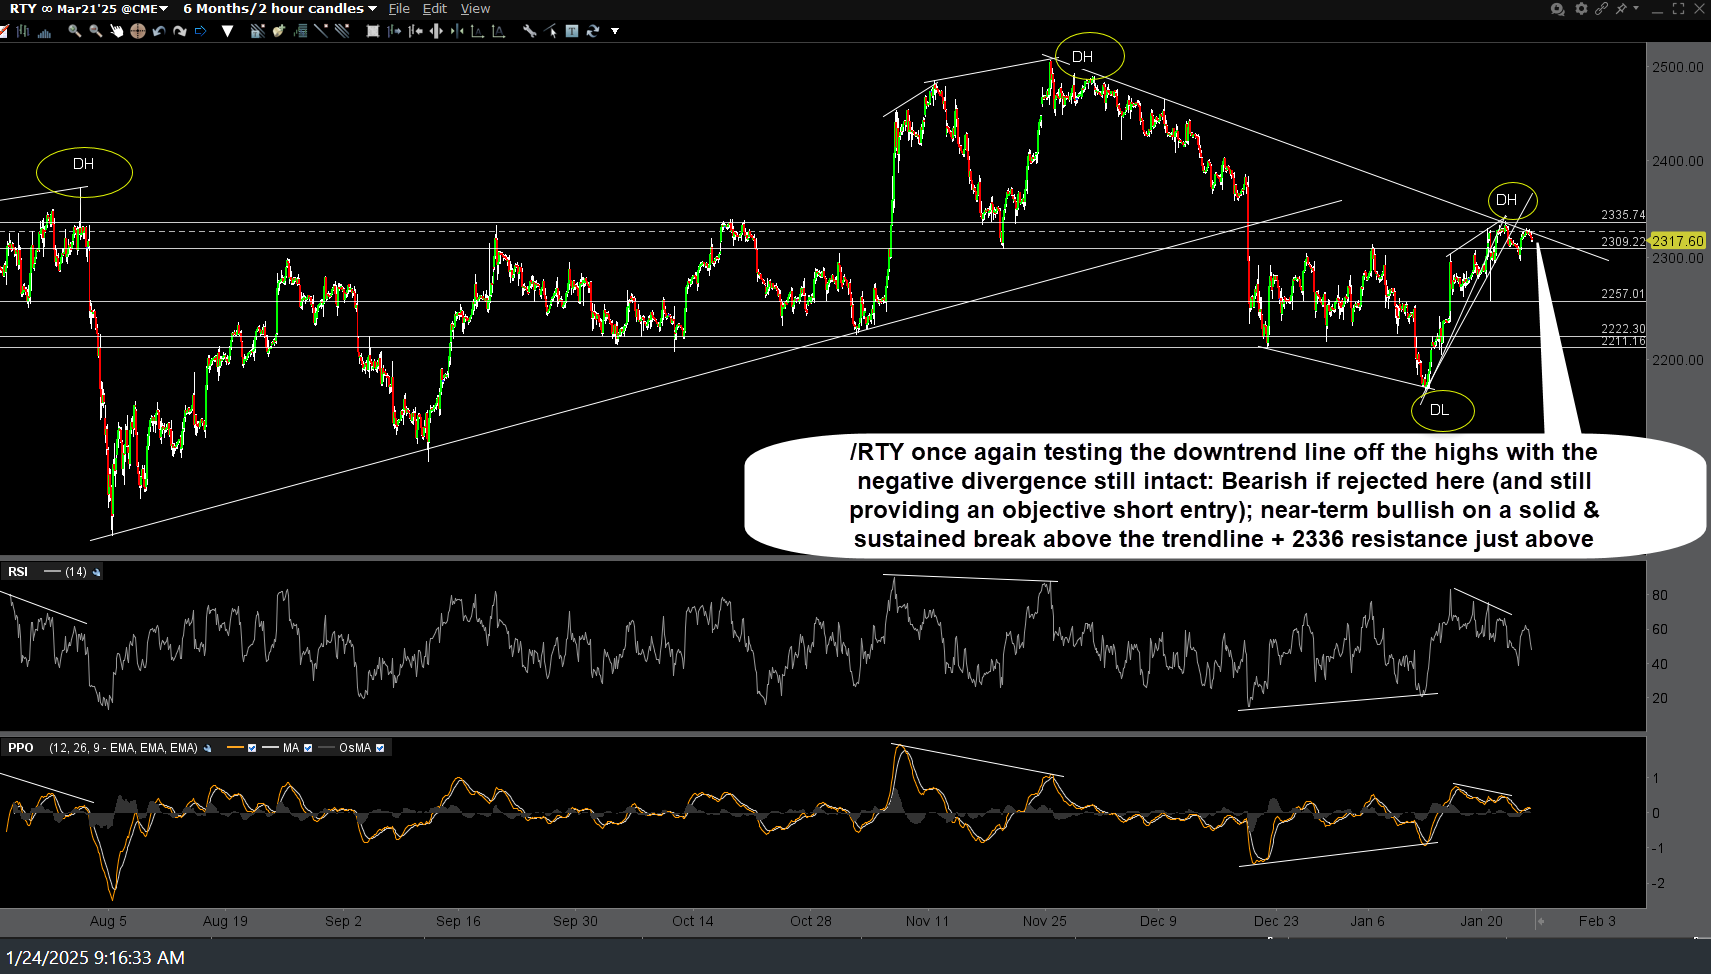
/RTY (Russell 2000 Small-cap Index futures) is once again testing the downtrend line off the highs with the negative divergence still intact: Bearish if rejected here (and still providing an objective short entry); near-term bullish on a solid & sustained break above the trendline + 2336 resistance just above. Previous & updated 120-minute charts below.


