
The stock market (S&P 500 shown here with a 6-month, 120-minute candlestick chart of /ES) has been in a sideways trading range for over 5 months now: Great for active traders, frustrating for trend traders & investors. I’ve simplified these charts with the red & green key support & resistance levels which roughly define the tops & bottoms of the recent trading ranges. Powerful sell signal if/when /ES clearly breaks below this red 5790ish support while new highs likely if the green (6170) resistance is taken out.
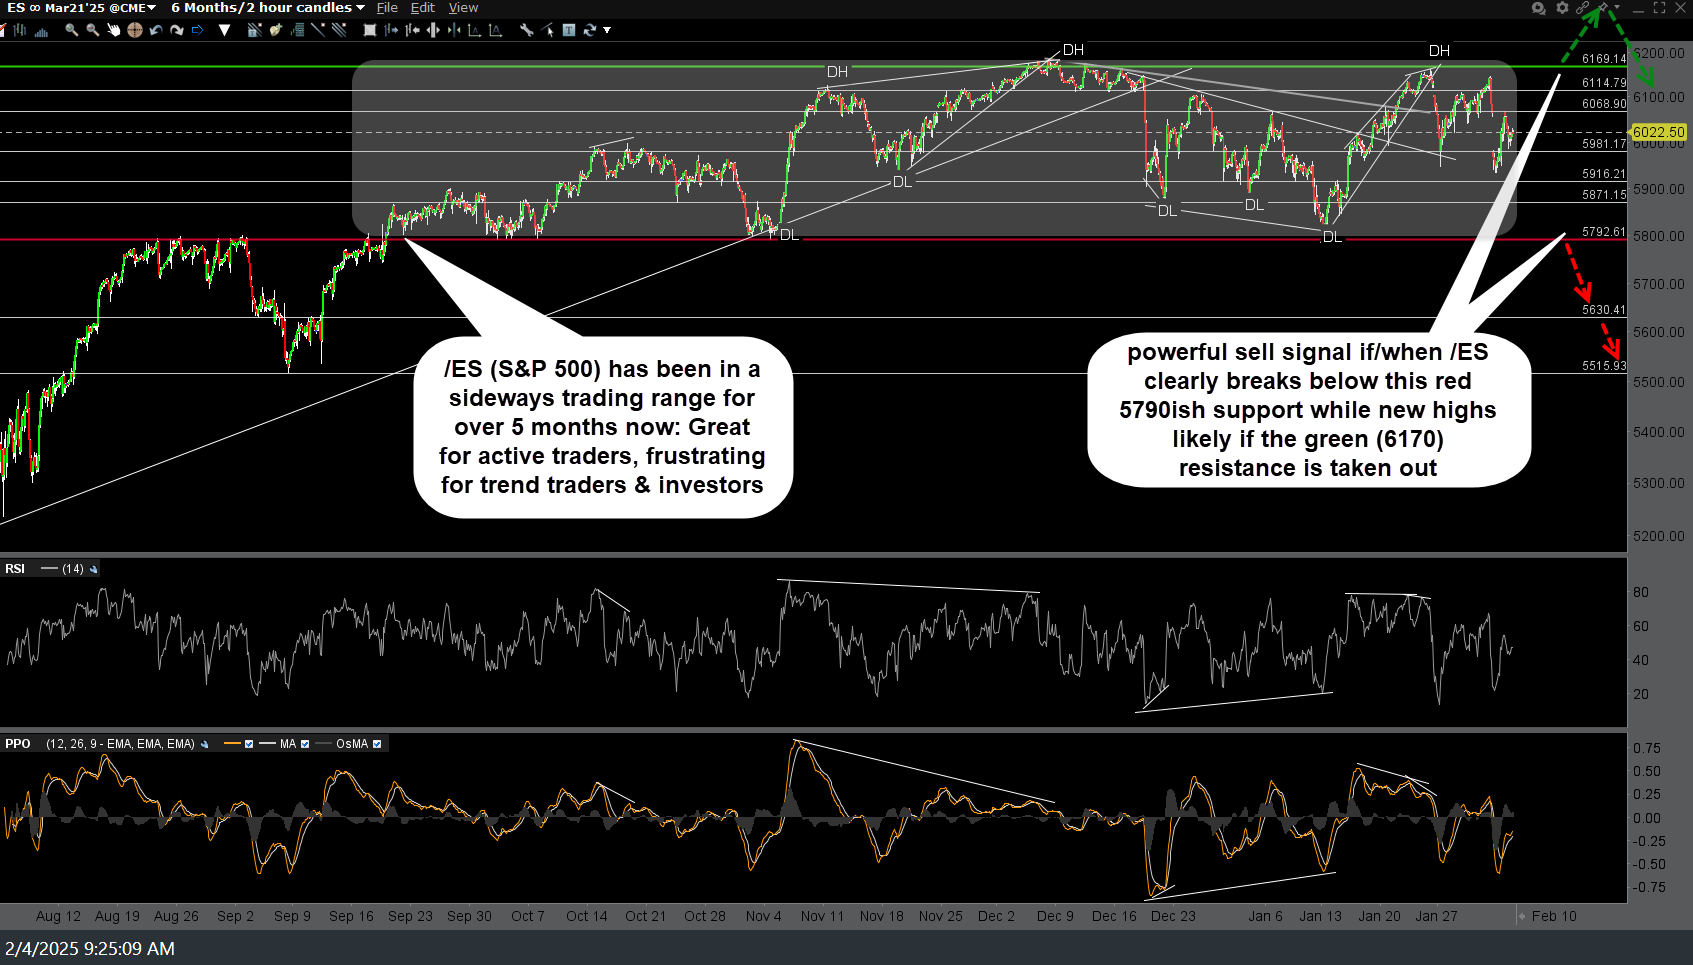
ES 120m Feb 4th
Looking at the 120-minute chart of /NQ (Nasdaq 100 futures), it’s been an active traders’ delight, trend traders fright; with /NQ bouncing around in a sideways trading range for over 3 months now. Powerful sell signal if/when /NQ clearly breaks below this red 20650ish support while new highs likely if the green (22100) resistance is taken out.
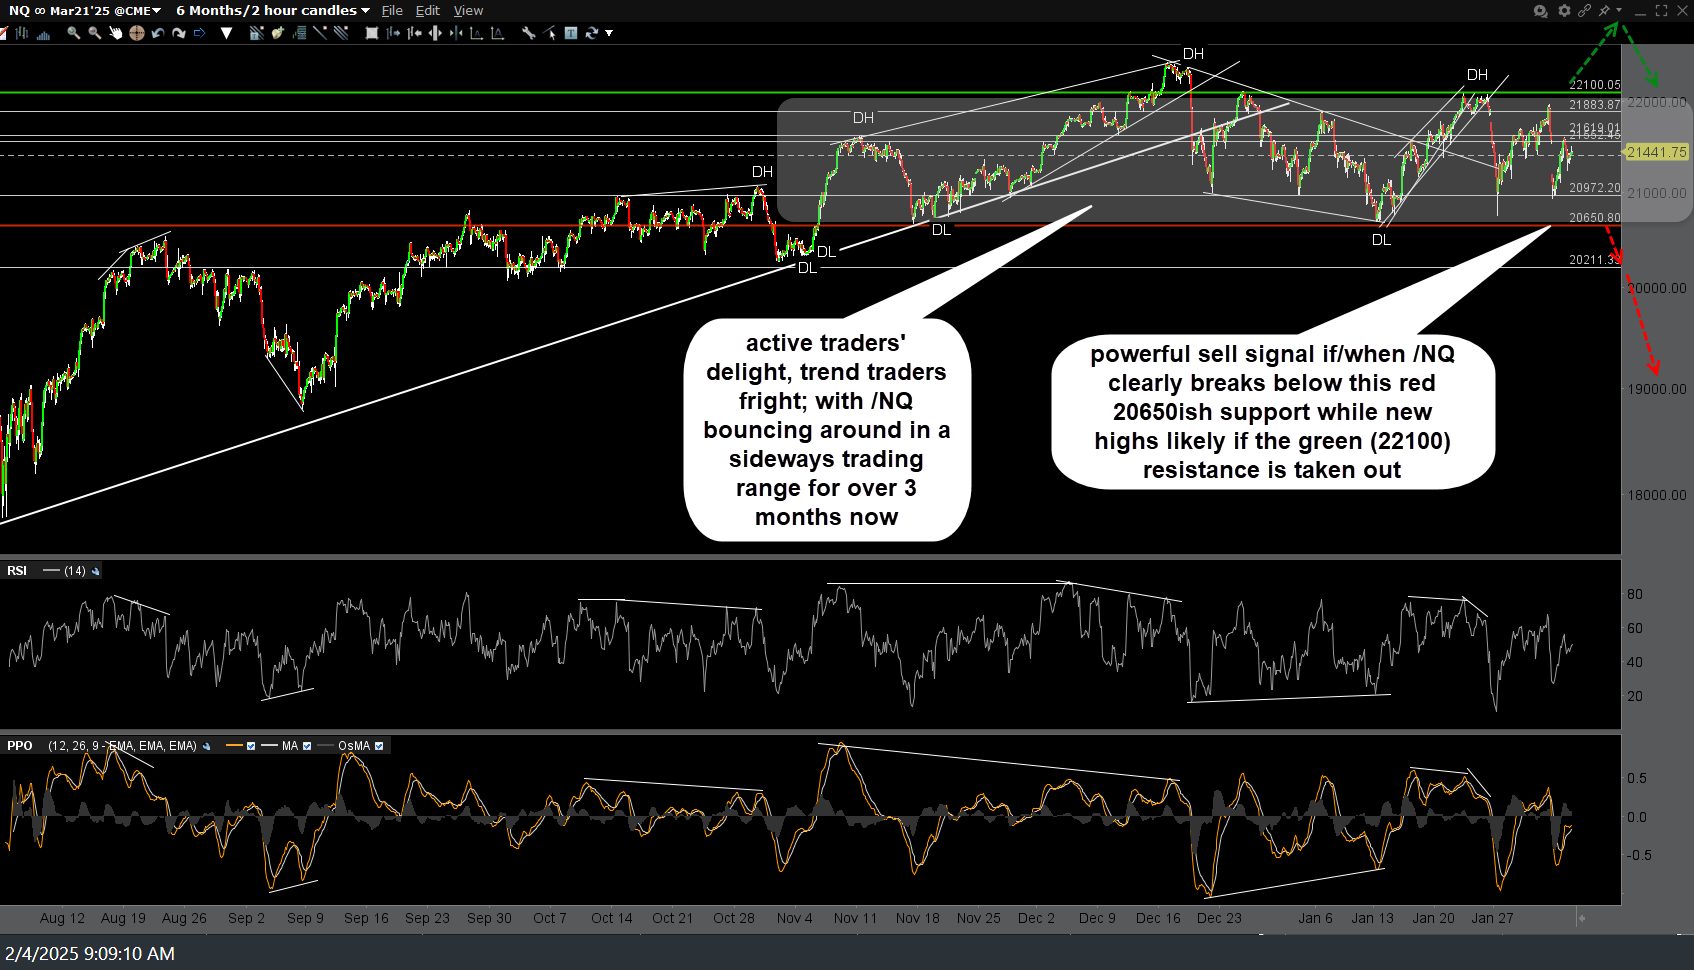
NQ 120m Feb 4th
Zooming down to the 60-minute chart, /NQ (or QQQ) continues to trade like an irregular EKG, with sell signals coming on breaks below the near-term uptrend lines & the next one to come on a break below this minor uptrend line.
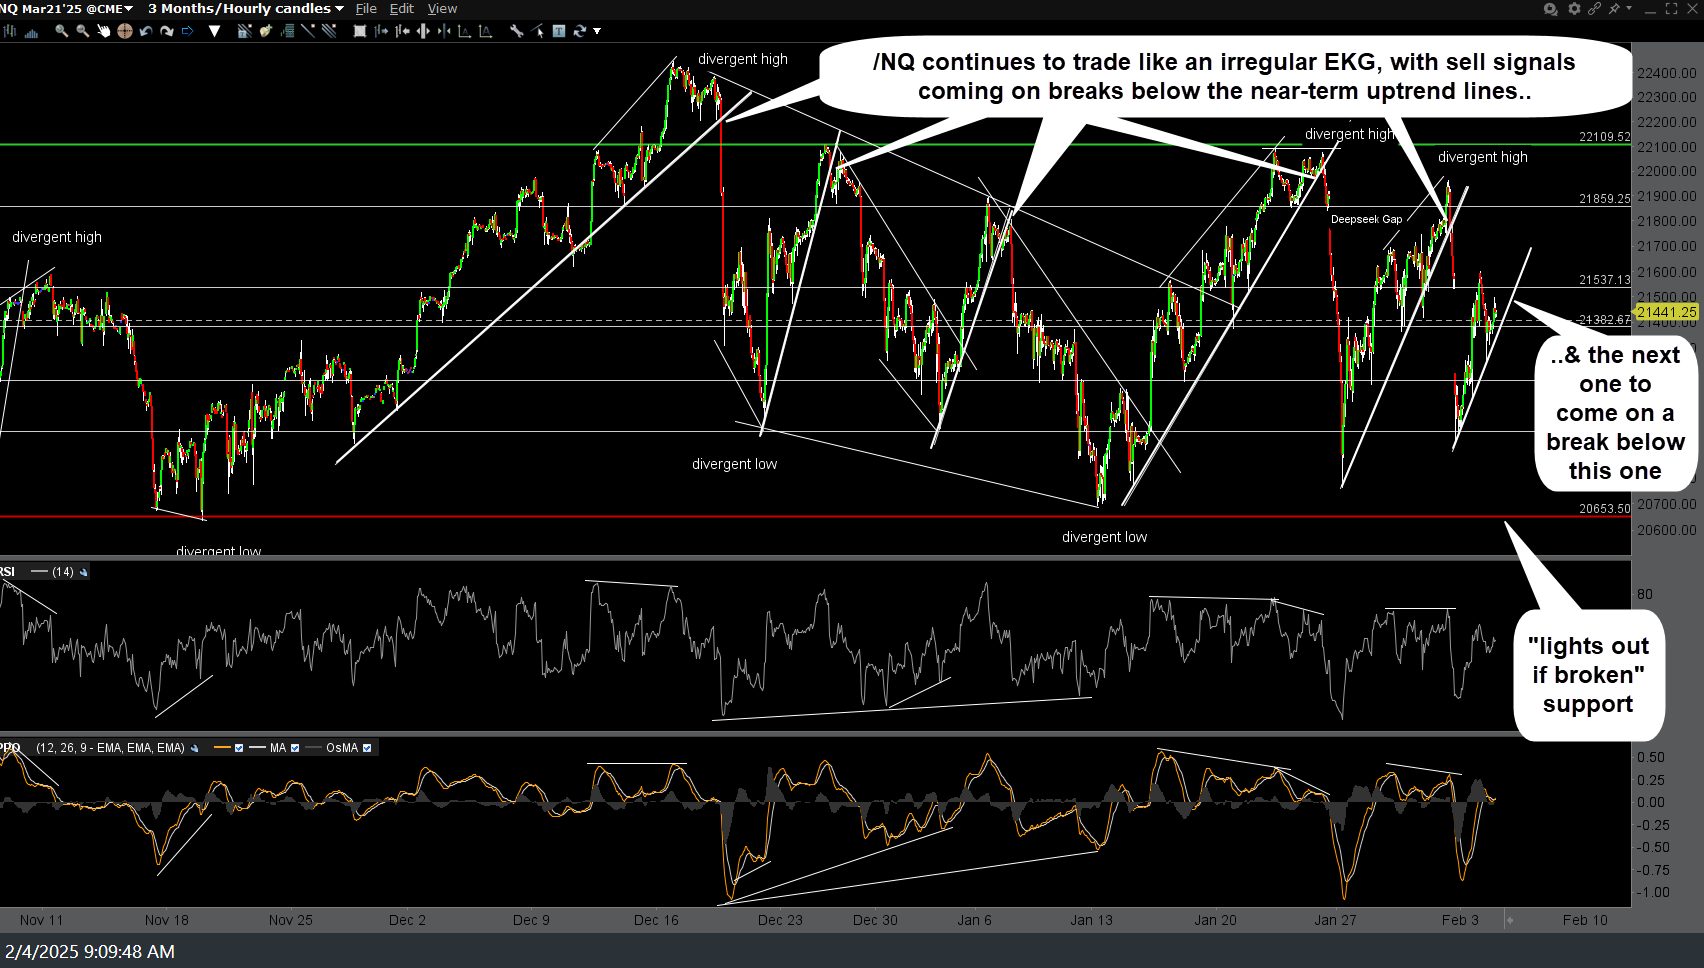
NQ 60m Feb 4th
Swing traders can either embrace the current trading environment for what it is, assuming they have the skillsets, time, & inclination to actively trade, or sit back & wait patiently for the market to decide which way it wants to break from this range, if less-active swing & trend trading is their preference & trading style.