
Just how overbought is the U.S. stock market? For starters, the Russell 2000 Small Cap Index has just hit the most extreme overbought level in over 14 years. On the 20-year daily chart below, I added a line at the 82 level on the RSI 14, which is one of, if not the most commonly used momentum indicators to measure how overbought or oversold an index or security is at any given time. Readings of 70 or more indicate overbought conditions while readings of 30 or below indicate that the security or index is oversold. (click on the charts below to expand & display in high-resolution)
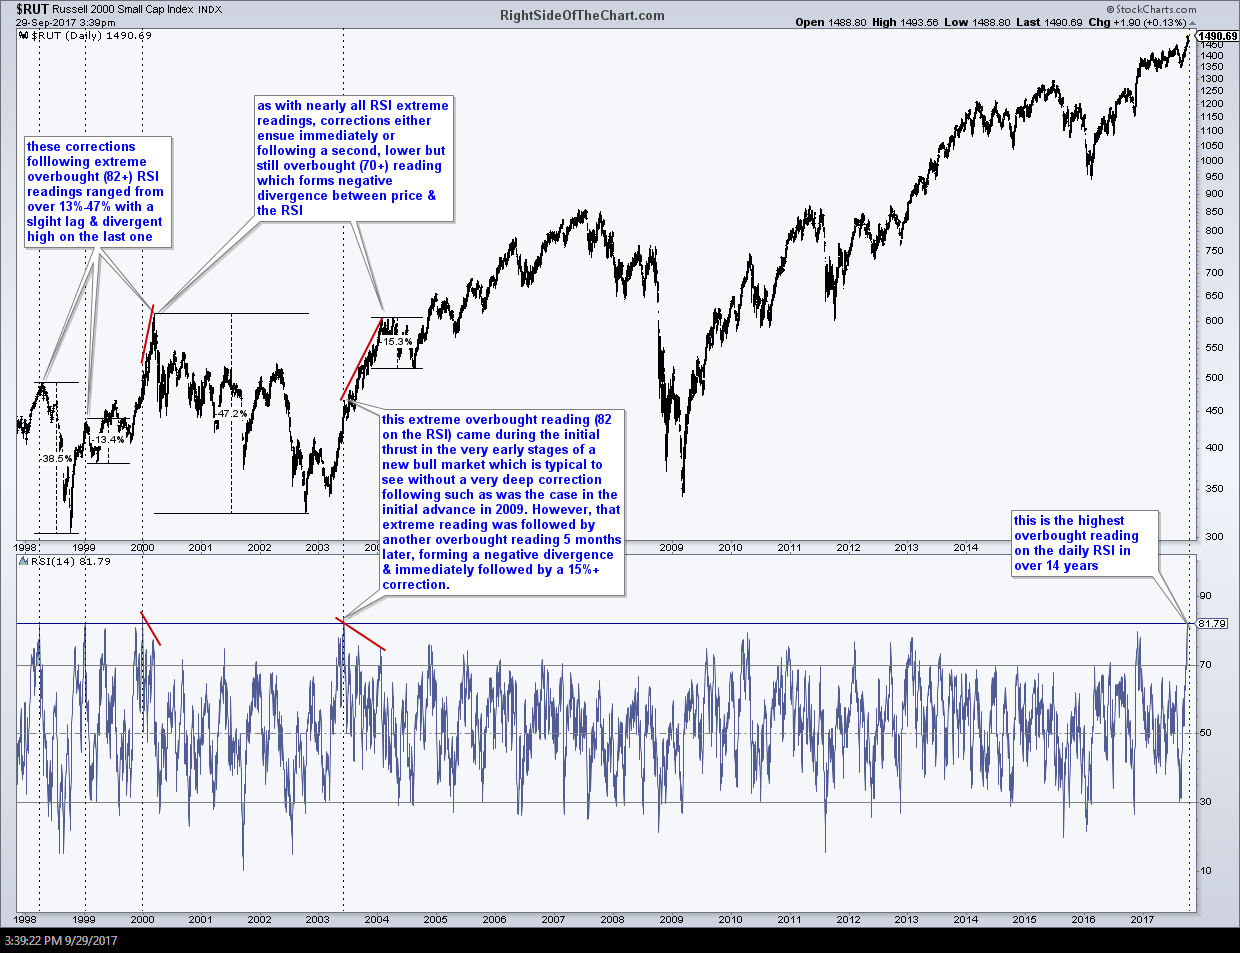
$RUT daily RSI extremes Sept 29th
Dashed vertical lines have been added on the chart above at each tag of the rarely seen 82 extreme level, which is shown by the uppermost horizontal line. The corrections on the previous 4 extreme readings shown on that chart range from about 13% to 47%, with the last 82+ reading back in June of 2003. As with nearly all extreme RSI readings, corrections either ensue immediately or following a second, lower but still overbought (70+) reading in relative close proximity which forms negative divergence between price & the RSI.
Moving to the other end of the market cap spectrum of the ‘risk-on’ indexes, we can see that the Nasdaq 100 large cap index also has a clear history of corrections following the rare extreme overbought readings of 82 on the daily RSI 14. In fact, the $NDX has only seen such rare extremes a total of 6 times in over the past two decades with two of those extreme 82+ readings (1/3rd) coming just recently in 2017 as what I often refer to as “double-tap” overbought readings; two overbought reading in close proximity with the 2nd overbought reading usually slightly lower than the first (thereby forming negative divergence). In fact, the divergence since the first extreme (82+) overbought reading in the $NDX early this year is still forming (expanding) as the RSI values continue to fall while the index values have continued to rise. The divergences currently in place between the Nasdaq 100 & the RSI are now the largest on record for the index, even exceeding the steep divergences that preceded the dot.com bubble market top in March of 2000, which was followed by a drop of over 80%.
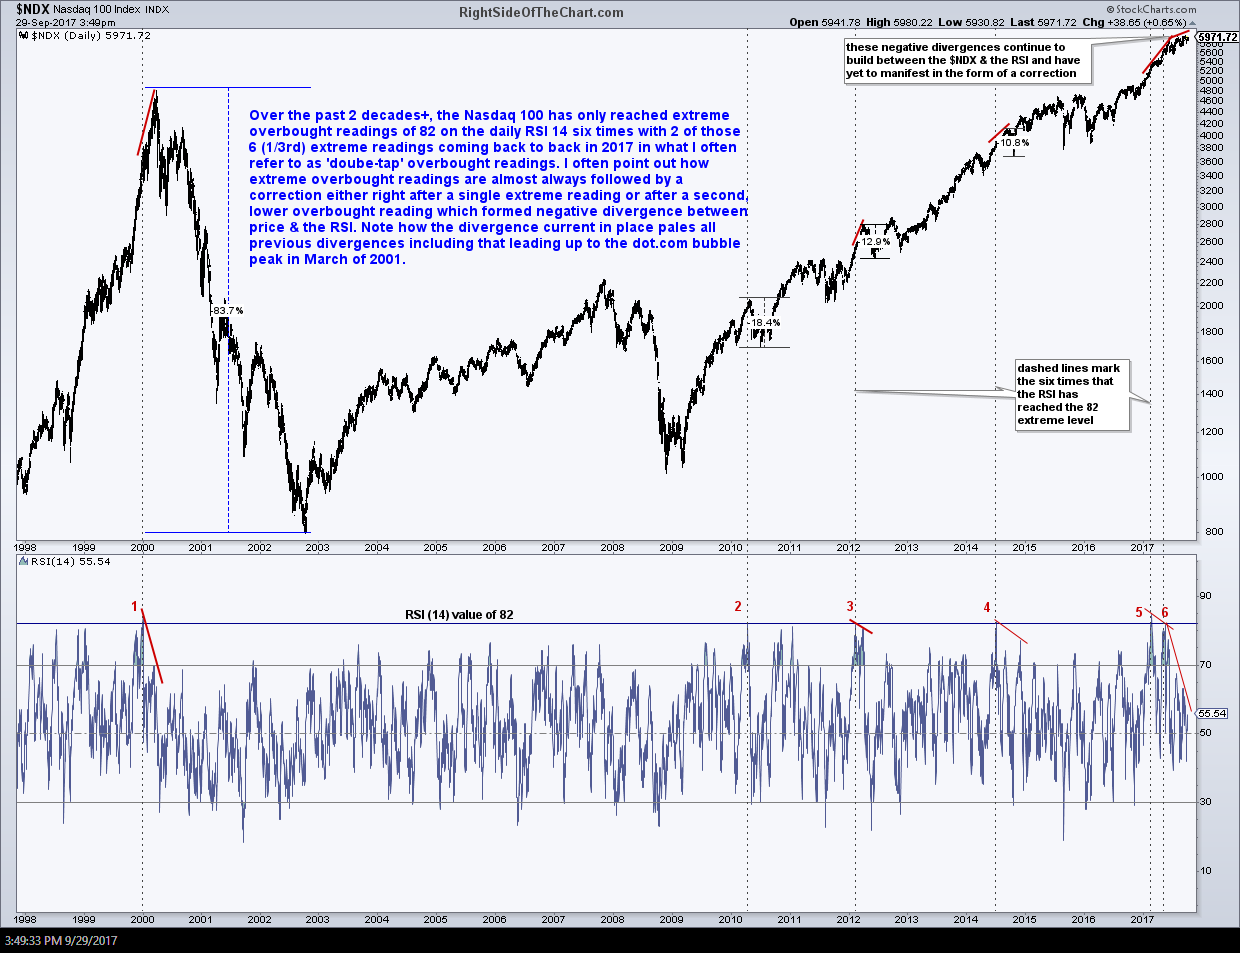
$NDX daily RSI extremes Sept 29th
As I often say, divergences as well as overbought conditions, especially during a bull market, are not sell signals, merely an indication of a likely trend reversal. That trend reversal could come in the form of a relatively mild pullback, correction or a more lasting trend reversal. Various factors go in to estimating the likely magnitude of the reversal & it is typically the scope of divergence along with other factors that can help gauge just how deep the next drop in the market will be.
-

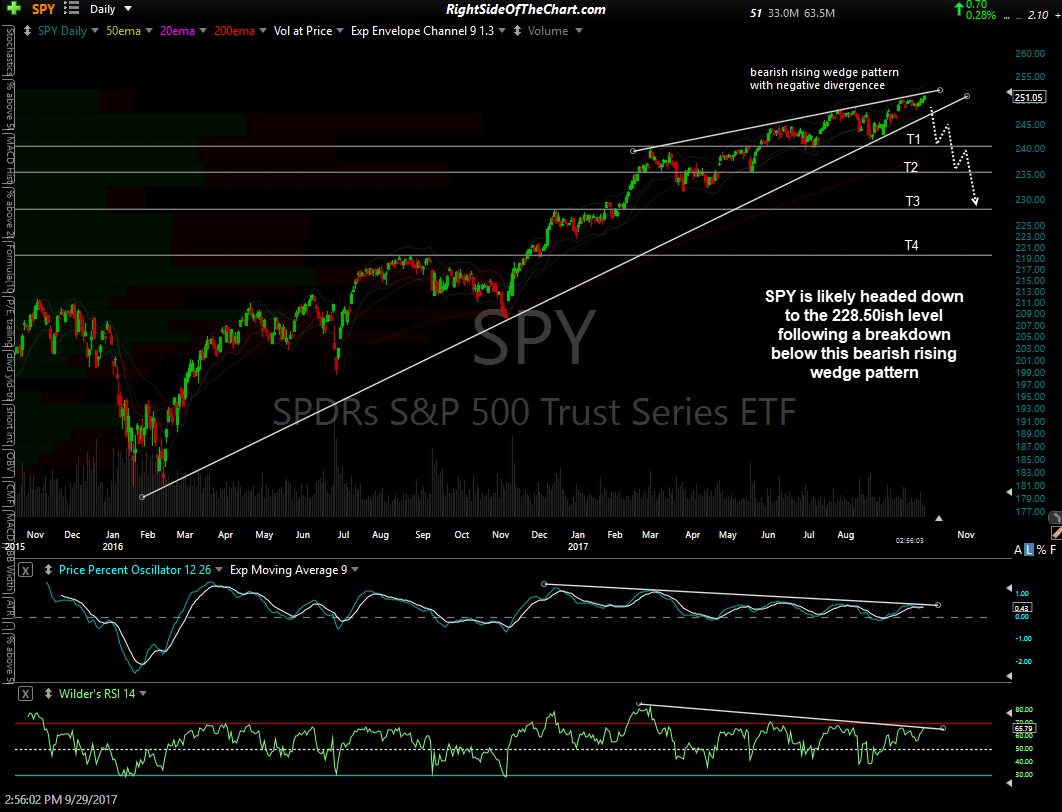
- SPY daily Sept 29th
-
- QQQ daily Sept 29th
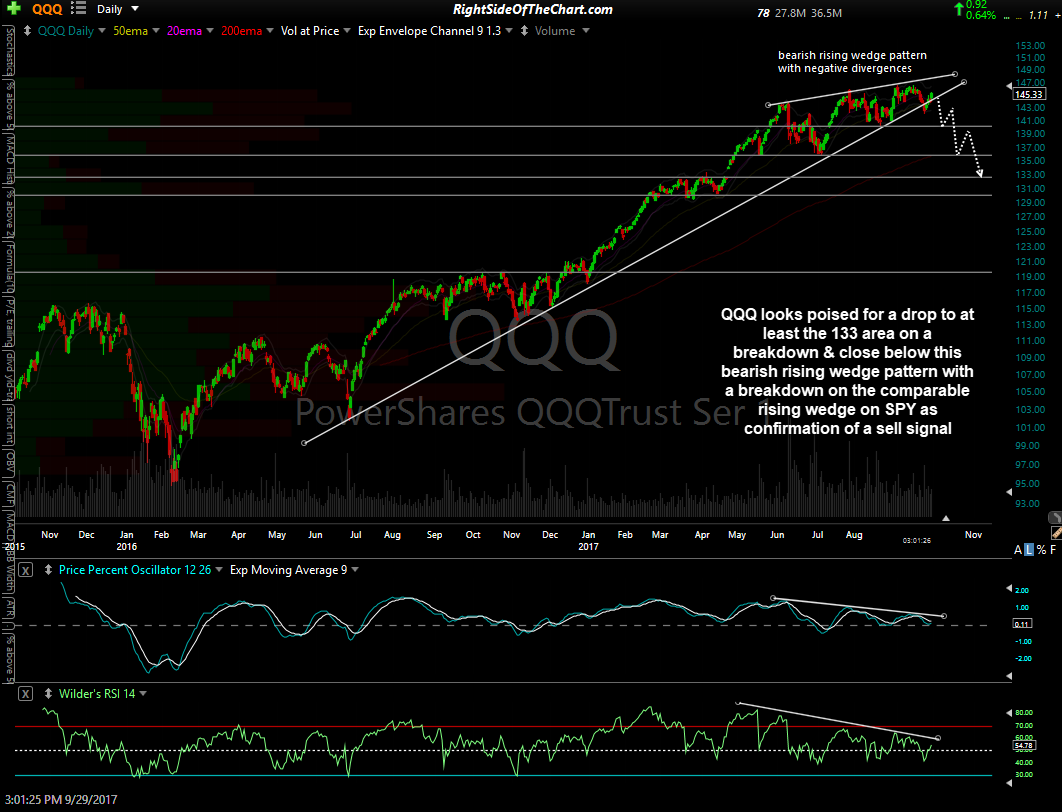
With divergences & overbought conditions mainly used as a “heads up” that a reversal is coming, we then look for high probability sell signals in order to position accordingly. A break & daily close below both of these bearish rising wedge patterns on SPY & QQQ will be about as good a sell signal on the broad markets as it gets IMO. Until then, I will continue to focus on trading the most bullish & bearish sectors & individual stocks while the broad markets slowly grinds higher within these wedges from the sector rotation within it.