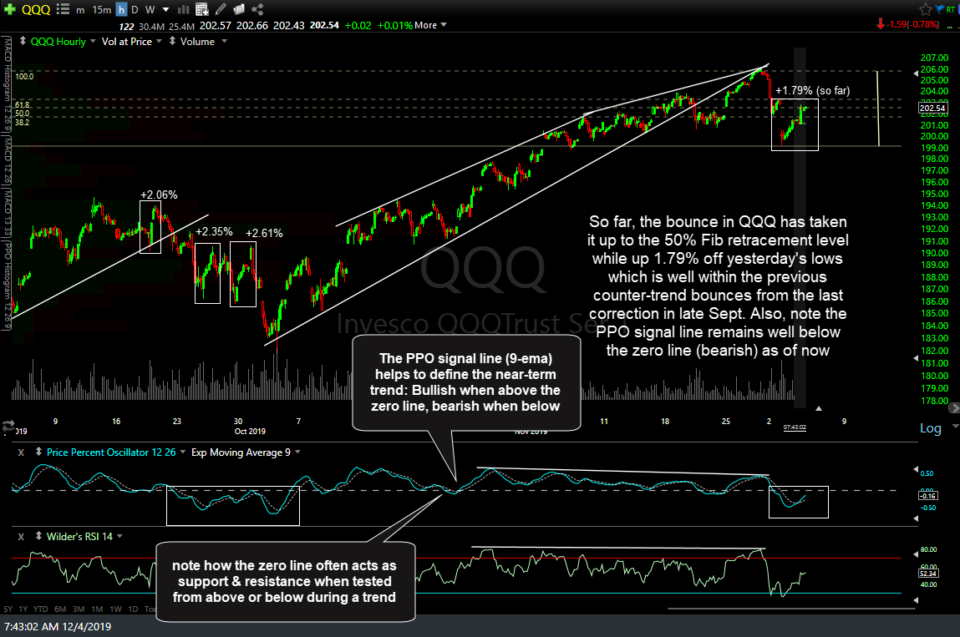
In yesterday’s closing market wrap video I had highlighted some levels in that may indicate that the correction off last Wednesday’s highs has likely ended if those levels are taken out. I’d also like to point out a few things to watch on this updated 60-minute chart of QQQ which included today’s pre-market gains as of 7:43 am.
The first thing to note is that so far, QQQ has rallied up to the 50% Fibonacci retracement level (i.e.- it has retraced half of the drop off Wednesday’s high). Should this prove to be just the first counter-trend bounce within a larger correction with more downside to come, which is still my preferred scenario, then the bounce so far is well within the norm of a typical counter-trend rally within a larger trend which often fall between the 38.2% – 61.8% Fibonacci retracement levels.
I’ve also highlighted the three counter-trend rallies that occurred during the last correction in September when QQQ fell 6.62% off the Sept 12th reaction high. Those counter-trend rallies measured 2.06%, 2.35%, and 2.61% (note how each those drops were progressively larger, typical with most corrections). As of this morning’s pre-market high QQQ has rallied 1.79% off yesterday’s low so far, well within & even below the lower end of those previous counter-trend bounces.
One additional development worth monitoring is the posture of the PPO signal line (9-ema or white dashed line). Over the years I have found that the PPO signal line on the 60-minute time frame helps to define the near-term trend: Bullish when above the zero line, bearish when below. Once the PPO signal line crosses below or above the zero line, indicating that the trend has changed from bullish to bearish, it often acts as support & resistance when tested from above or below during a trend.
The signal line made a solid cross below the zero line yesterday & currently remains well below it at this time. As such, that trend indicator remains on a sell signal for now so I’ll be watching for a potential bullish cross back above the zero line, should QQQ continue to build on the recent rally, especially if it can break back above the 203.68ish resistance level highlighted in last night’s video.
Bottom line: As of now, based on the developments mentioned above as well as those highlighted on the daily time frame recently, it appears to me that this is most likely a counter-trend bounce within a larger correction with limited upside before the next leg down & as such, it appears that QQQ or any of the major stock indexes offer an objective short entry around current levels & up to but not much beyond the 204 level on QQQ. My minimum price target would be the support zone that runs from about 194.40-195.70 leaning towards a drop to the lower-end of that zone. That would be a drop of about 4% from current levels so a stop 1-2% above would offer an attractive R/R of 2:1 or better although the potential for a much deeper correction is still decent & as such, the R/R would be significantly higher if one were to use a ~2% stop & let a short position run while periodically trailing down stops to protect gains, should the trade start to pan out.


