
End of day stock market analysis via SPY, QQQ, /ES & /NQ (E-mini futures) highlighting some recent developments as well as some key levels to watch going forward this week.
playback speed can be increased in the settings to reduce video duration
I had intended to include coverage of the two charts below. The first chart is a daily chart of /ES (S&P 500 E-mini futures) which closed the regular session at price resistance with the even more significant recently broken 3-yr uptrend line slightly above.
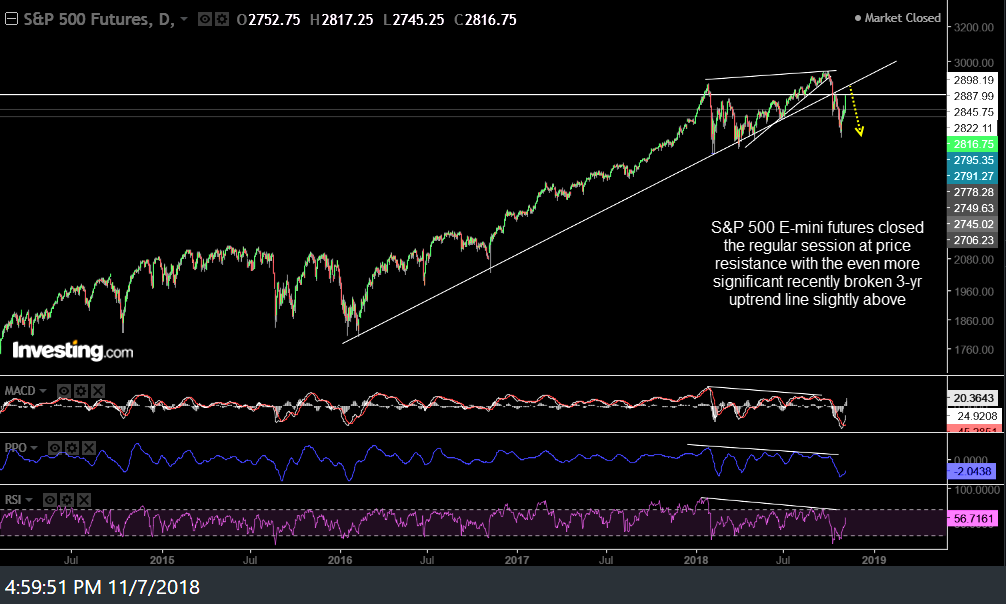
ES daily Nov 7th
The next chart shows that this snap-back rally has taken the Nasdaq 100 E-mini futures up for a backtest of the recently broken key 3-yr uptrend line (former support which should now act as resistance when tested from below).
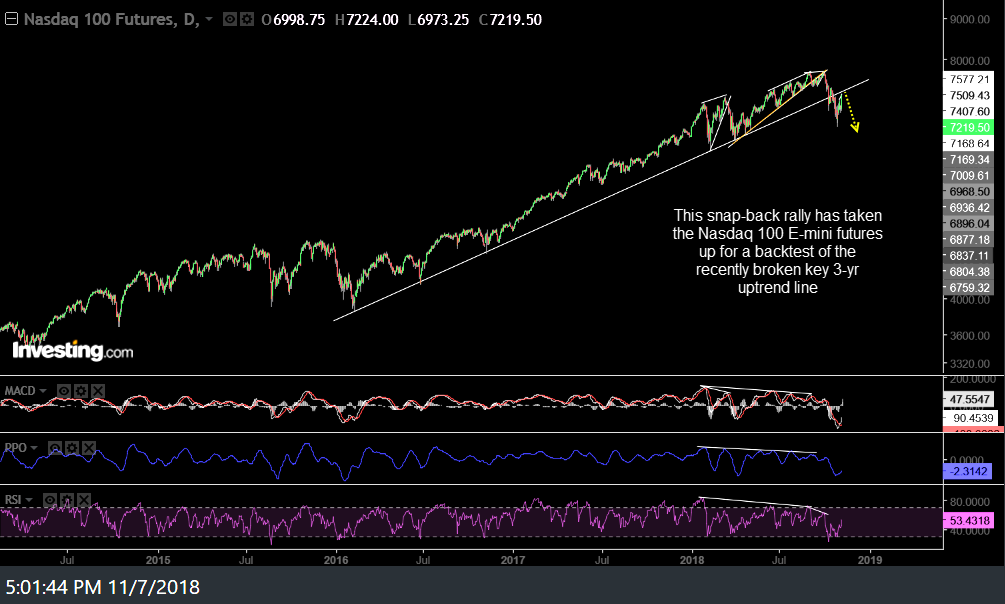
NQ daily Oct 7th