
The triple converging support levels on the 60-minute chart of /NQ highlighted in the video early today we all taken out with the 12:30 EST hourly candlestick, thereby triggered a near-term sell signal & any stops placed just below as suggested in the video for those that came into the day long.
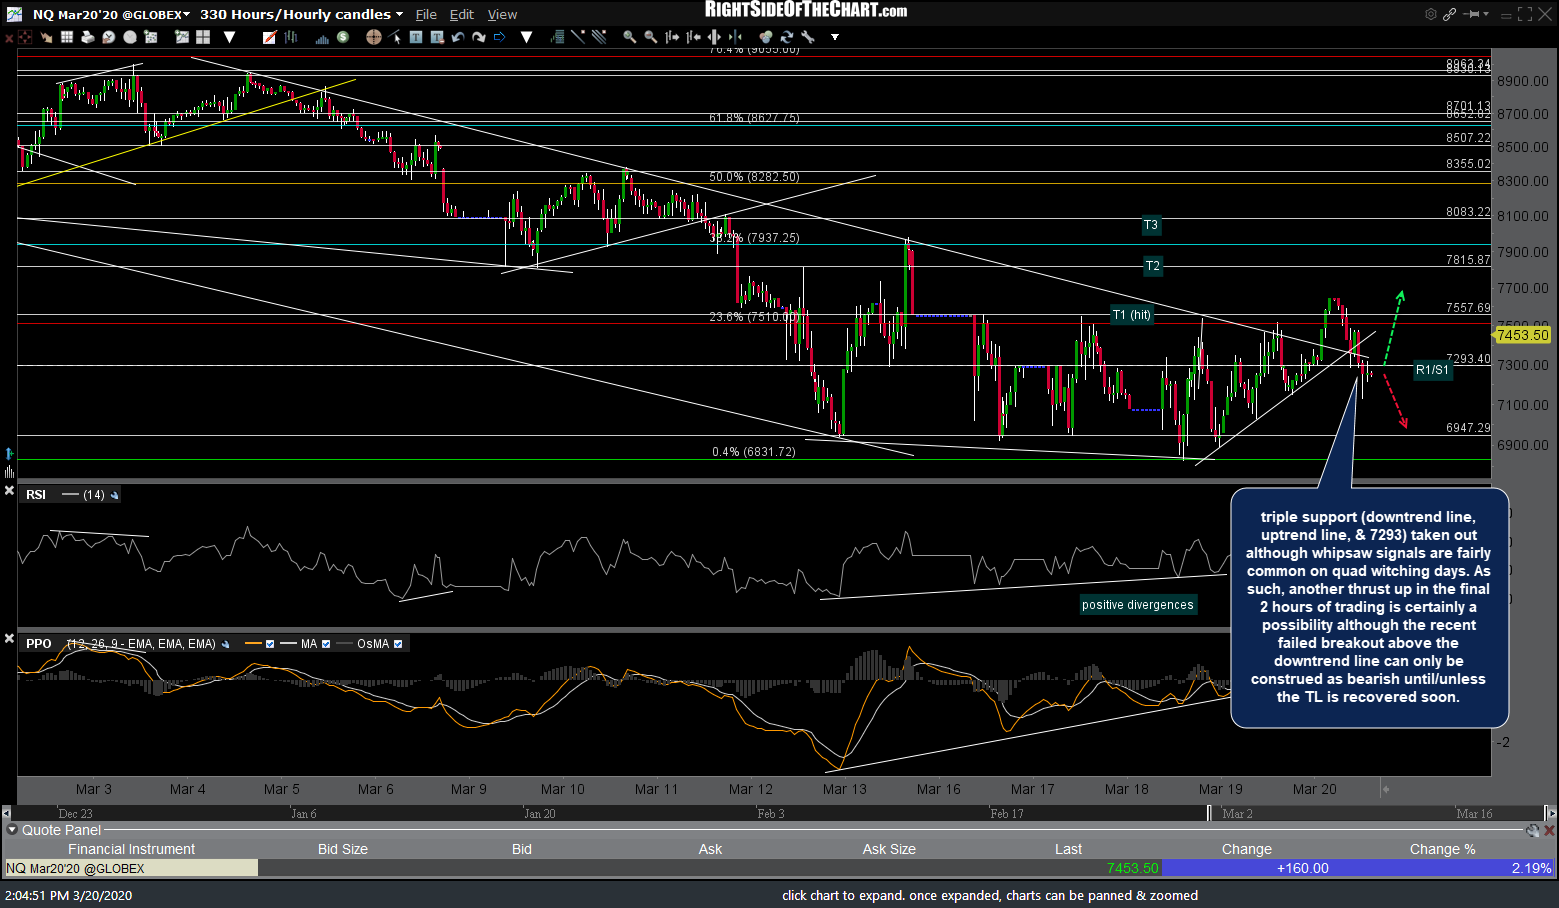
NQ 60m 2 March 20th
The comparable short-term uptrend lines off the recent lows on IWM & /RTY covered in the video were also taken out impulsively at the same time /NQ broke support. While those are clearly bearish technical events, the odds for whipsaw signals (false breakouts/breakdowns) increase on quadruple witching days so we certainly can’t rule out another thrust up in the final hour of trading today or just as we can’t rule out that the end of the counter-trend rally is over with the next leg down to come.
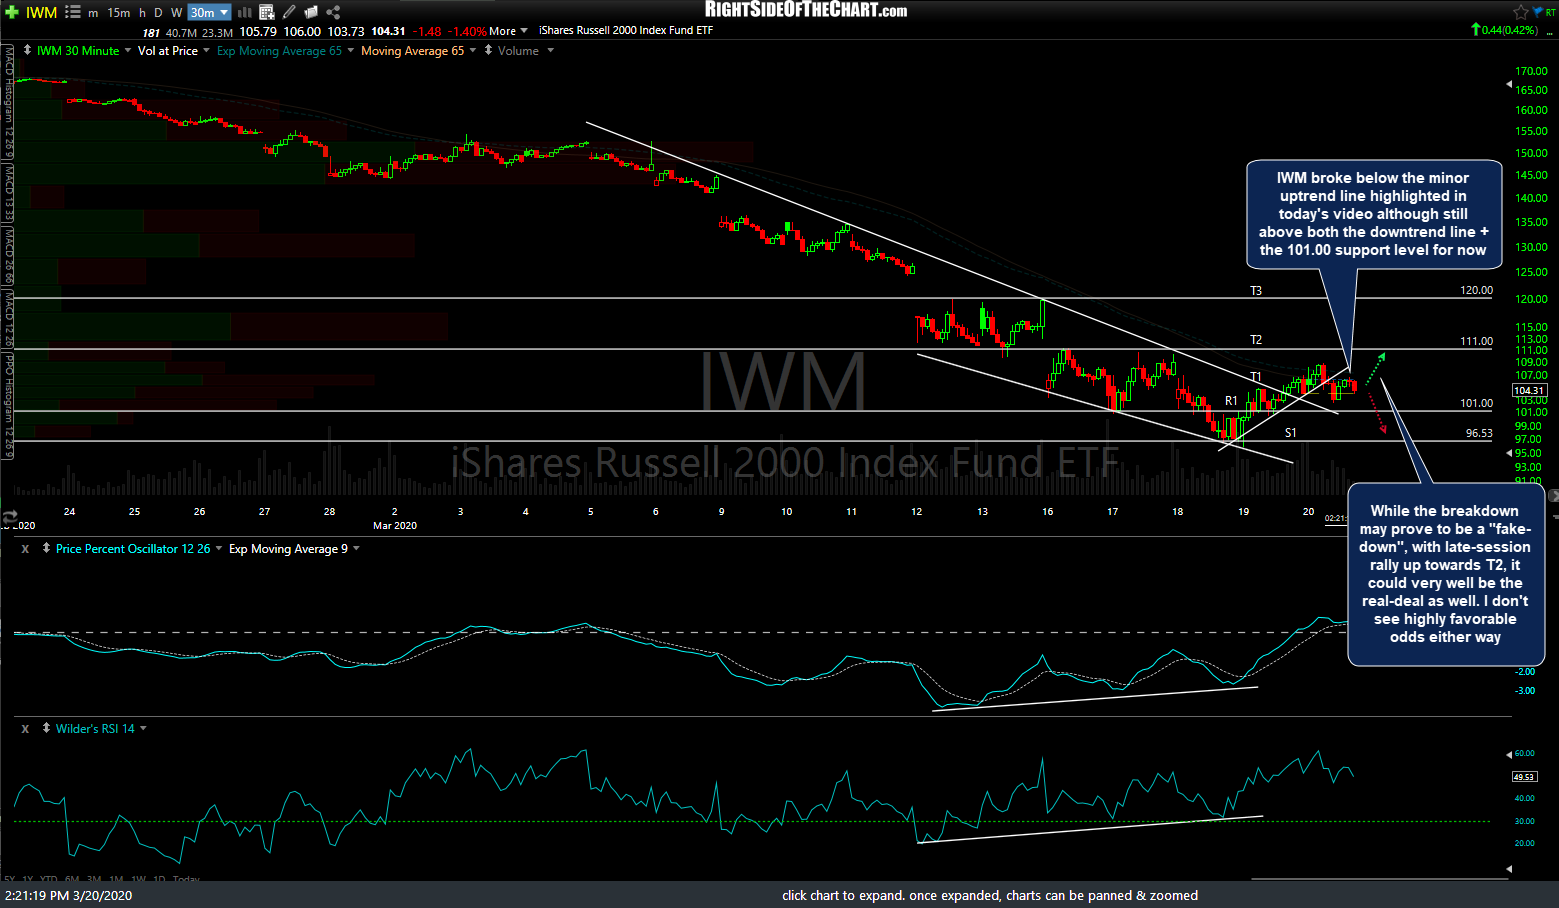
IWM 30m 2 March 20th

RTY 60m March 20th
Bottom line: I don’t have a strong read on where the market goes from here. Best to keep things light today, especially regarding any new swing position as we are about to head into the weekend with an extra 2-days of overnight risk. Only time will tell how much short interest was cleared out, or added to today as well whether the put/call ratio will have increased or decreased substantially by the close today. I’d like to see how the market kicks off next week before considering any new positions. If anything material changes before the close, I do my best to post it asap.