
The bearish rising wedge patterns which were highlighted on the major stock indexes in yesterday’s video have all broken down, triggering near-term sell signals on the US stock market. 60-minute charts of /ES (S&P 500), /NQ (Nasdaq 100), and /RTY (Russell 2000) below. Note that all 3 indexes have currently fallen to the first minor support levels where the odds for a reaction are decent although I favor more downside & prefer not to try and game a bounce at this time due to the fact that the intermediate-term is still solidly bearish.
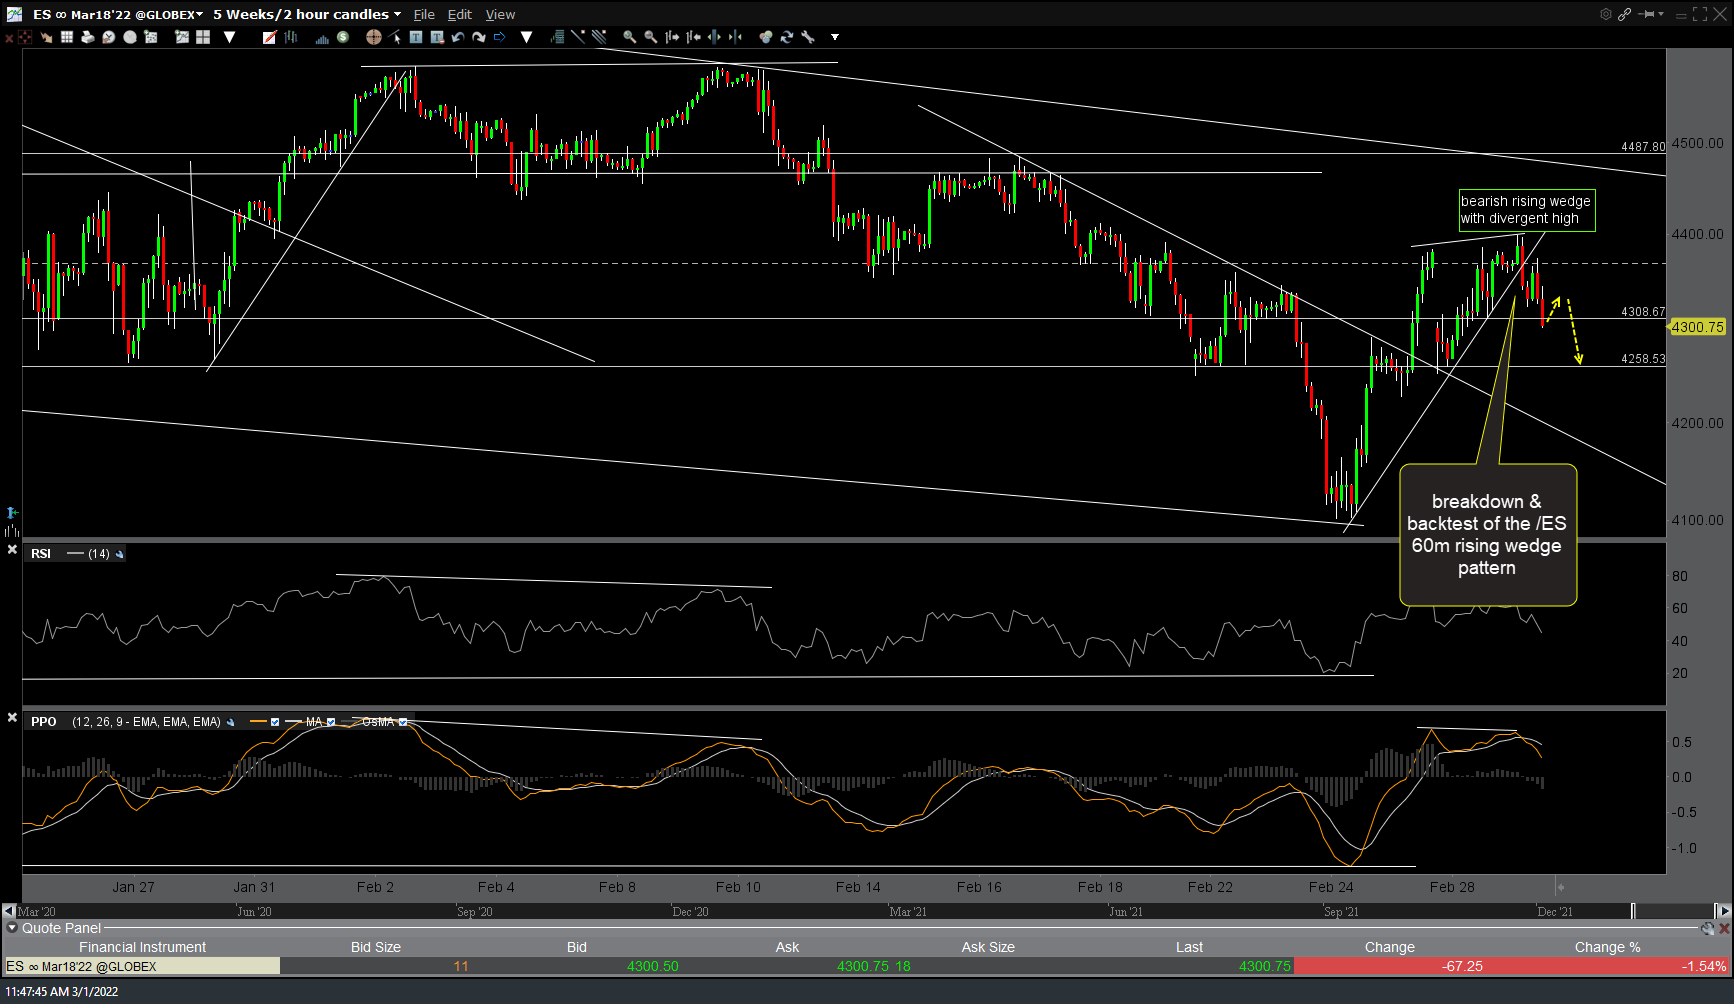
ES 60m March 1st
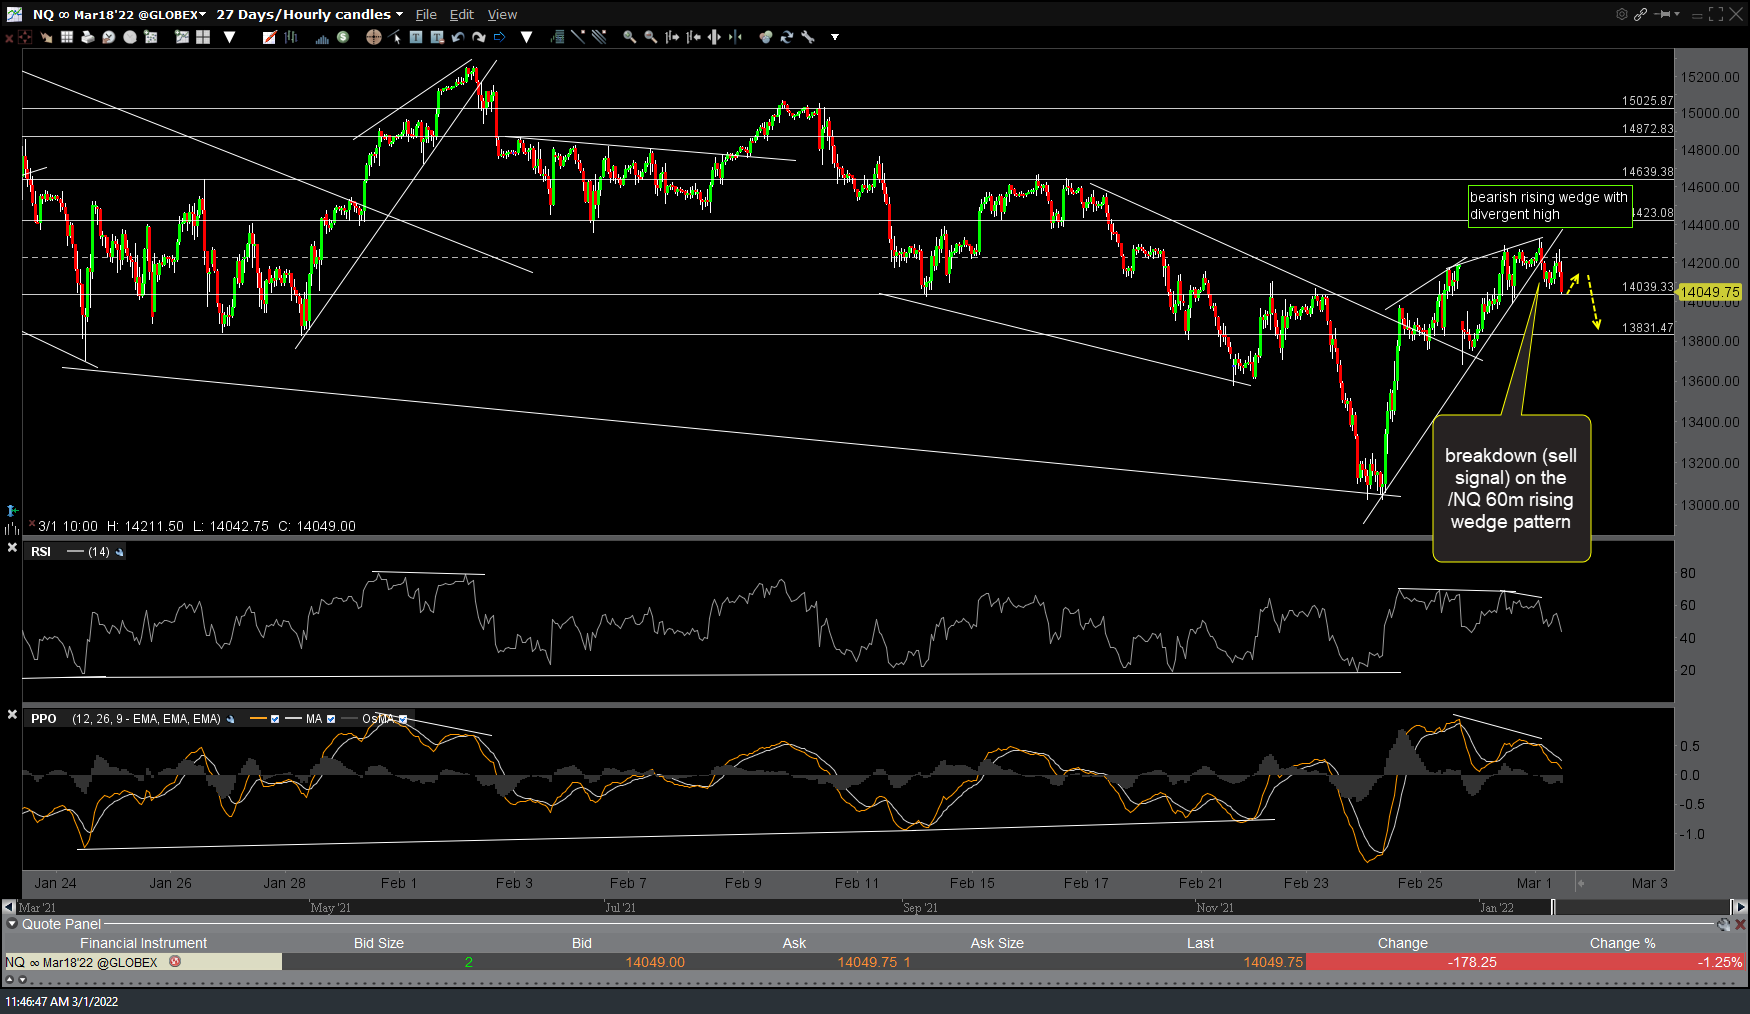
NQ 60m March 1st
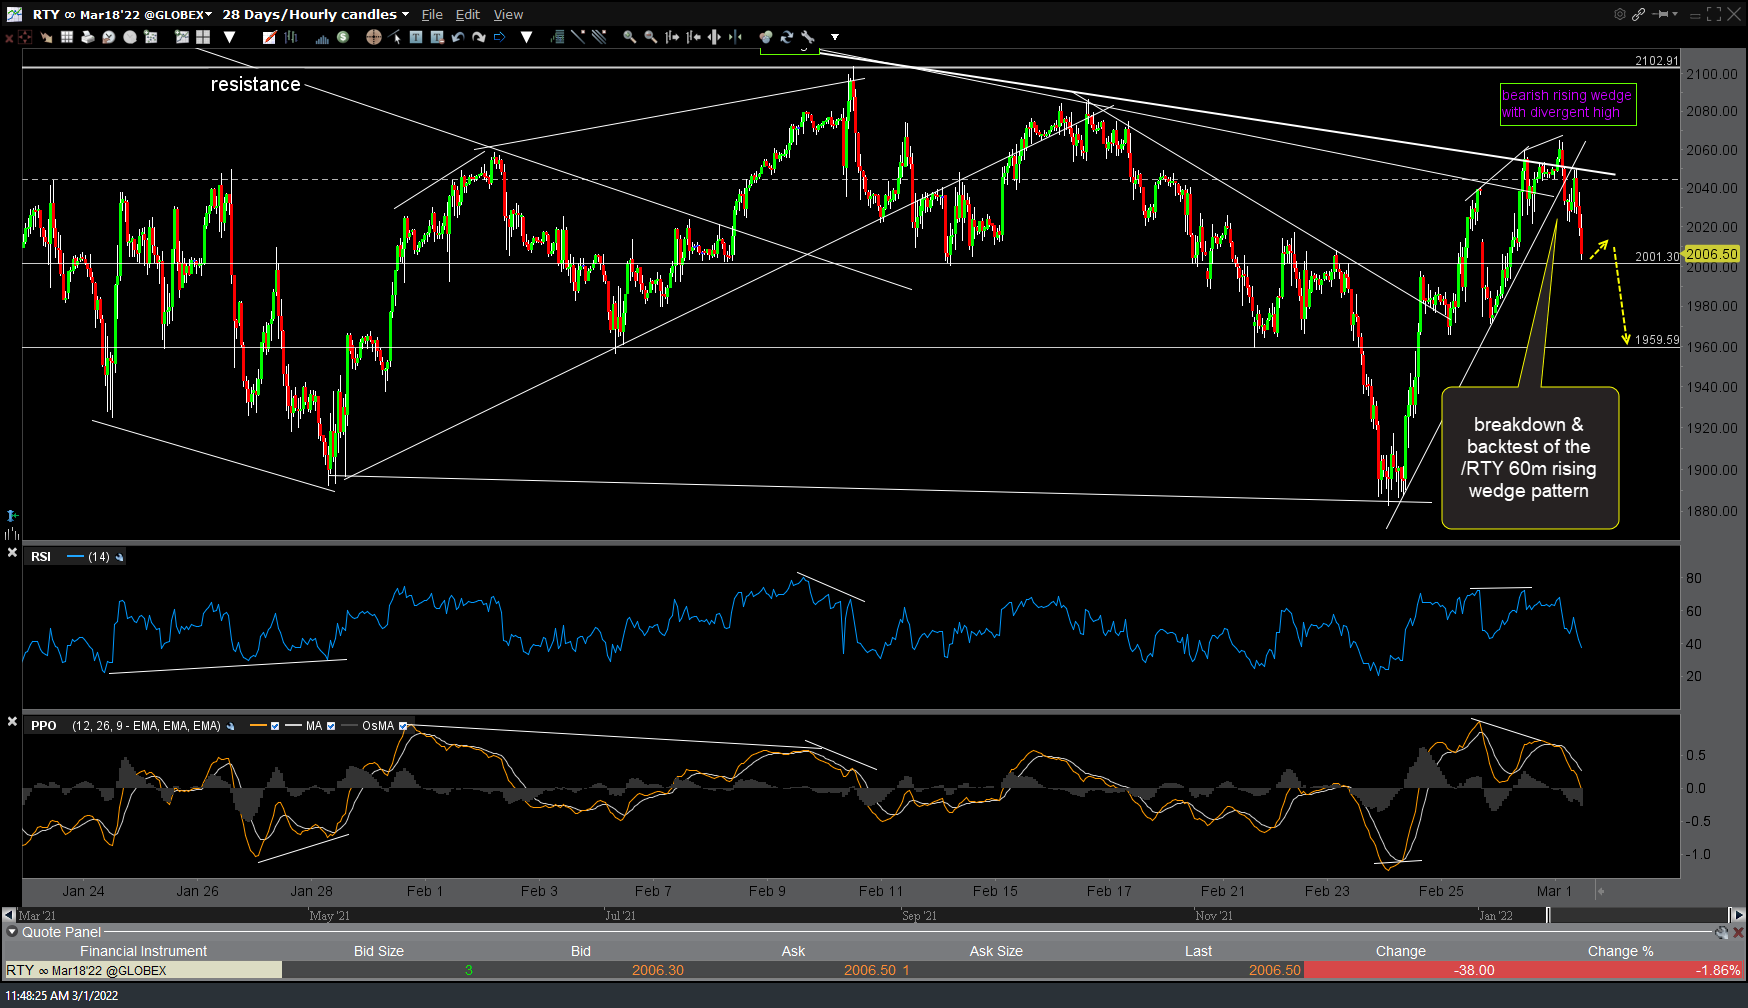
RTY 60m March 1st