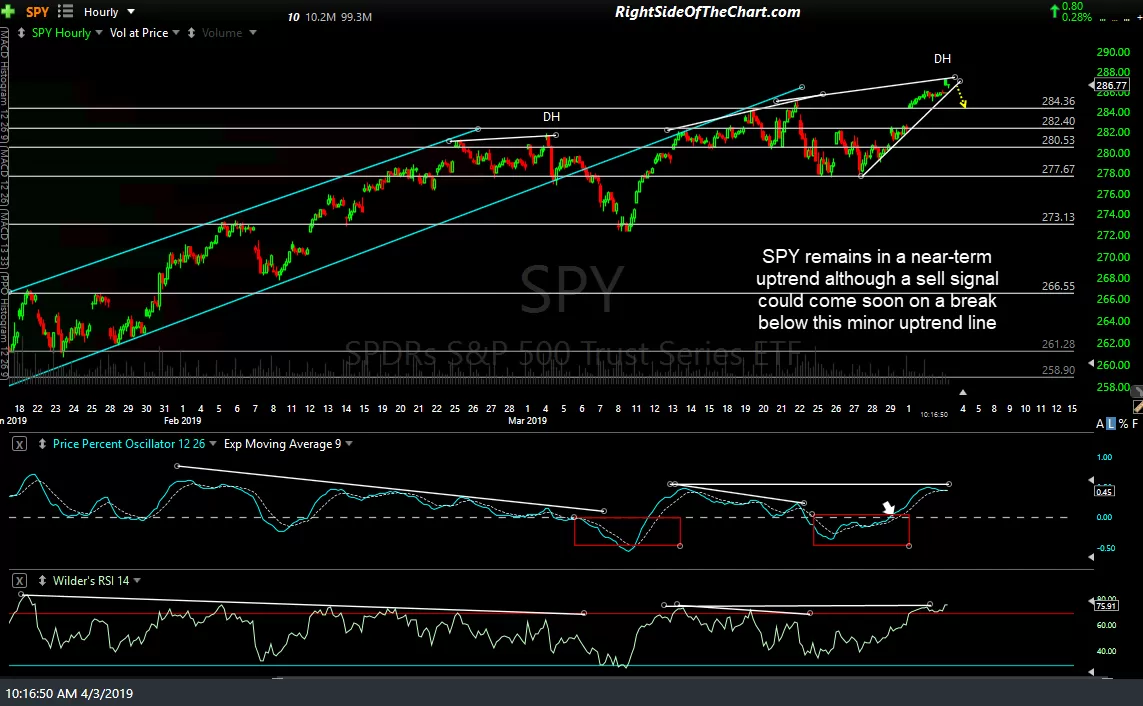
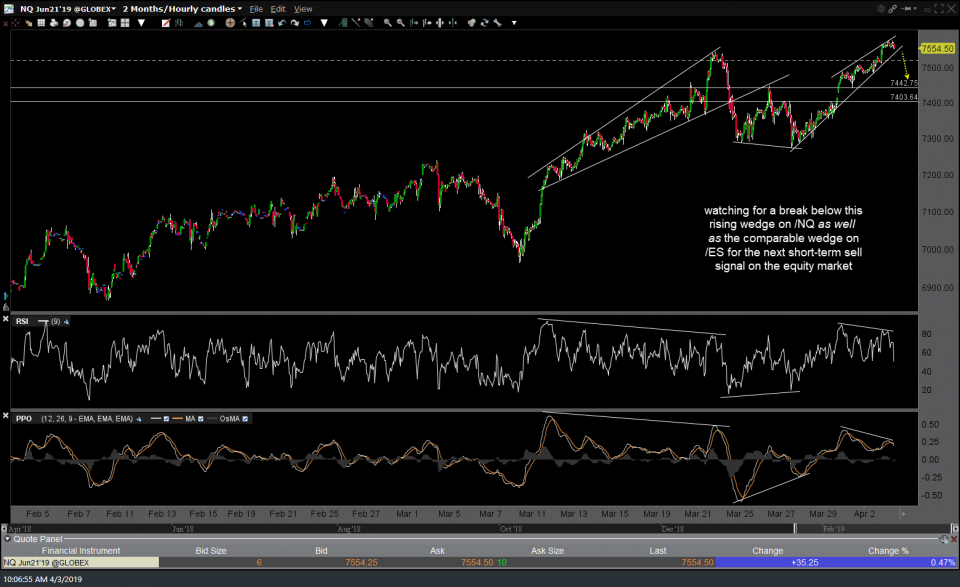
Both /ES & /NQ (S&P500 & Nasdaq 100 futures) continue to work their way higher within rising wedge patterns on the 60-minute time frames with negative divergences in place. /NQ is still comfortably within the wedge while /ES is currently testing the uptrend line that defines the bottom of its wedge but as I like to say, support is support until & unless broken. As such, we need to see both /ES & /NQ both clearly take out these uptrend lines for a short-term sell signal on the market.
-
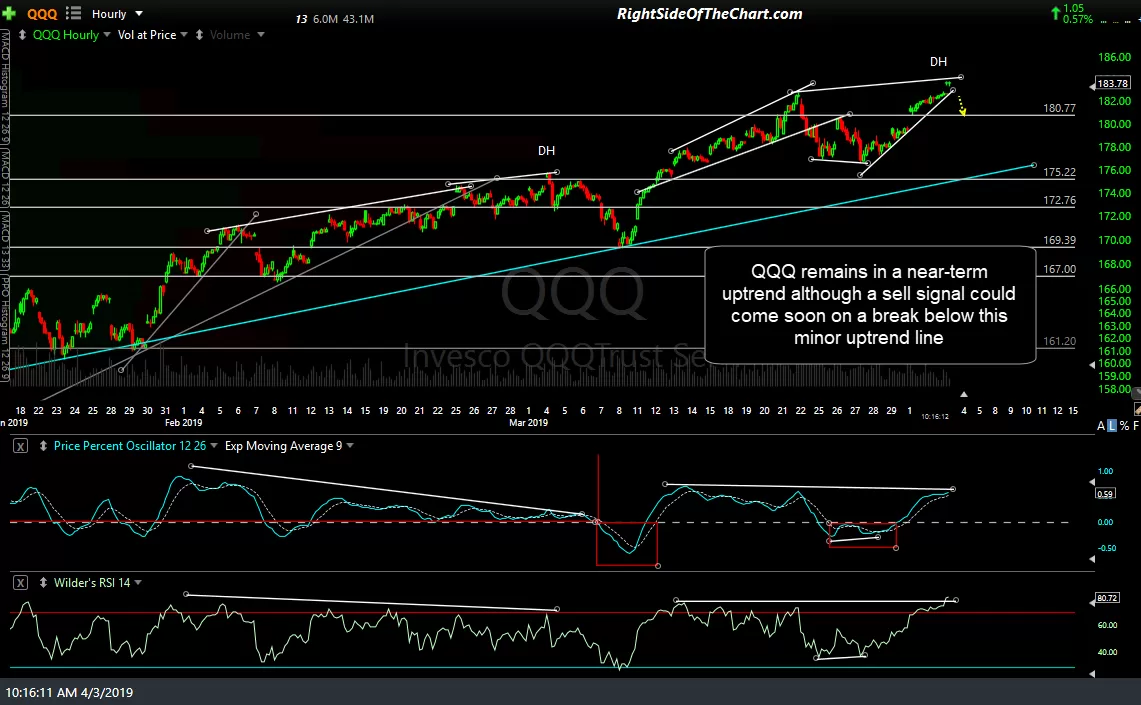
- NQ 60-min April 3rd

-
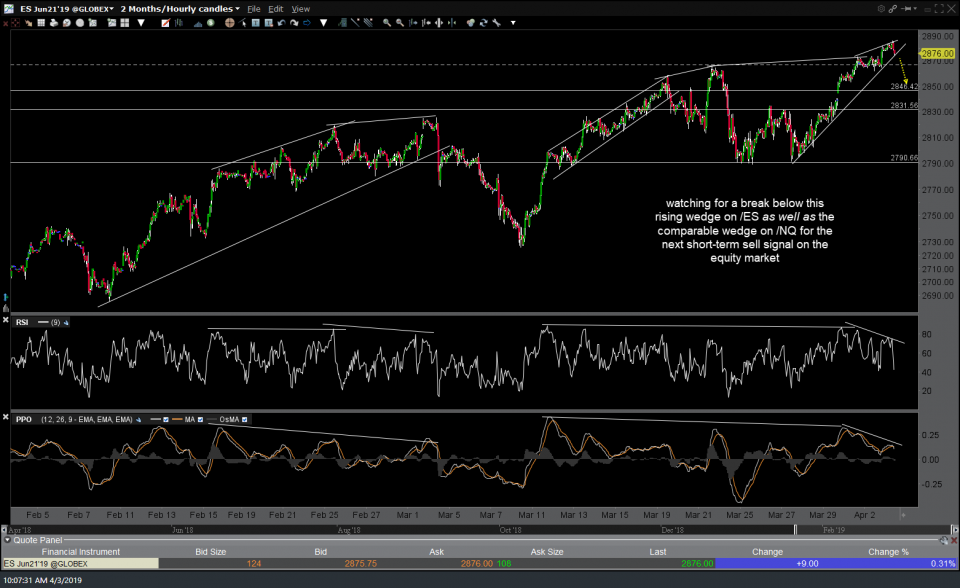
- ES 60-min April 3rd
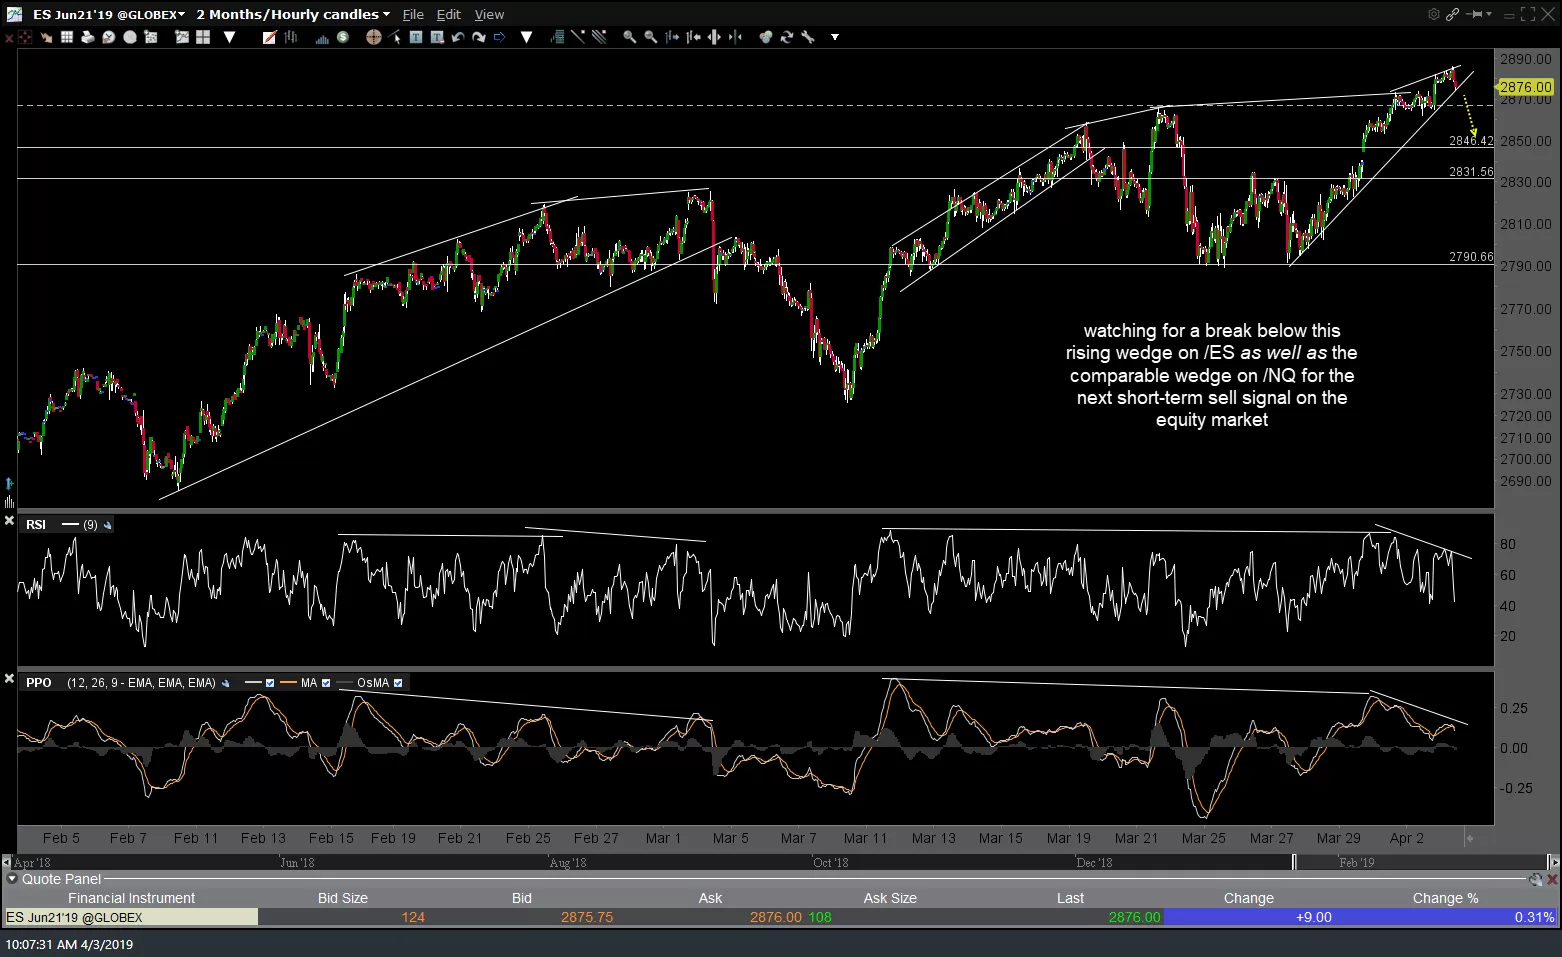
Should a sell signal trigger with both wedges breaking down, my mininum pullback target would be 2847 for /ES & 7443 for /NQ. Comparable targets on QQQ & SPY are 180.80 & 284.40. As of now, the very near-term trend since late last week is bullish but one thing to keep an eye on, should we get some near-term sell signal with a break of these patterns soon, would be those uptrend lines on the daily charts of the market leading FAAMG stocks that were highlighted in yesterday’s video, all of which are in close proximity & would likely be tested or possibly taken out, should both /ES & /NQ break down soon.
-
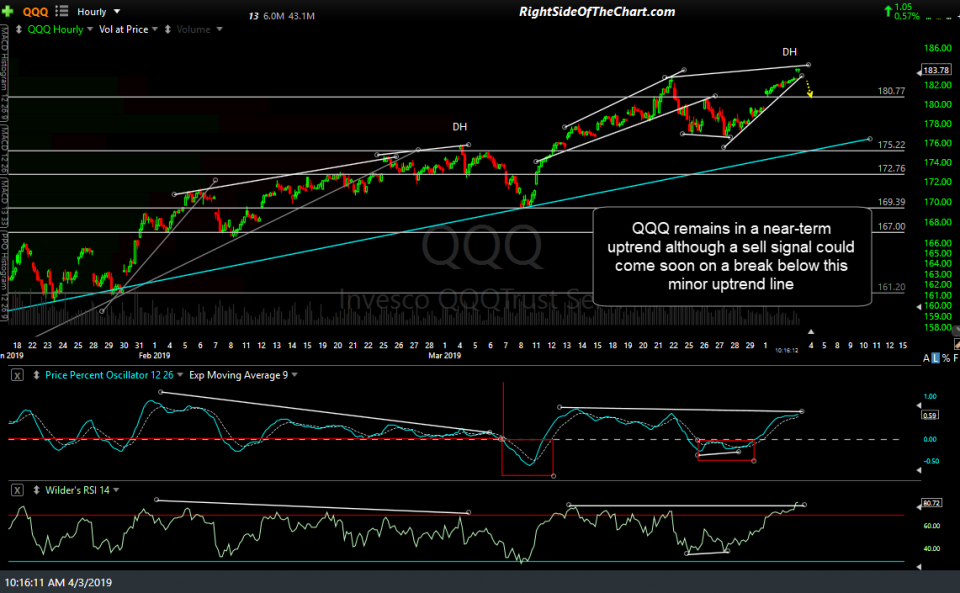
- QQQ 60-min April 3rd
-
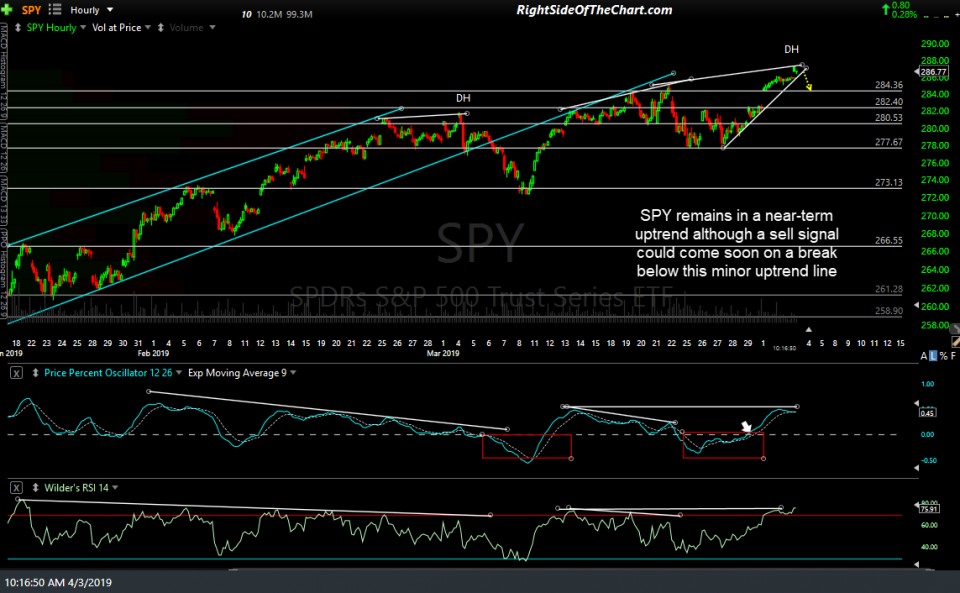
- SPY 60-min April 3rd