
QQQ sell signal to come on a solid break and/or 60-minute close below this rising wedge pattern AND breakdowns below the comparable 60m uptrend lines on /ES & SPY. 60-minute chart below.
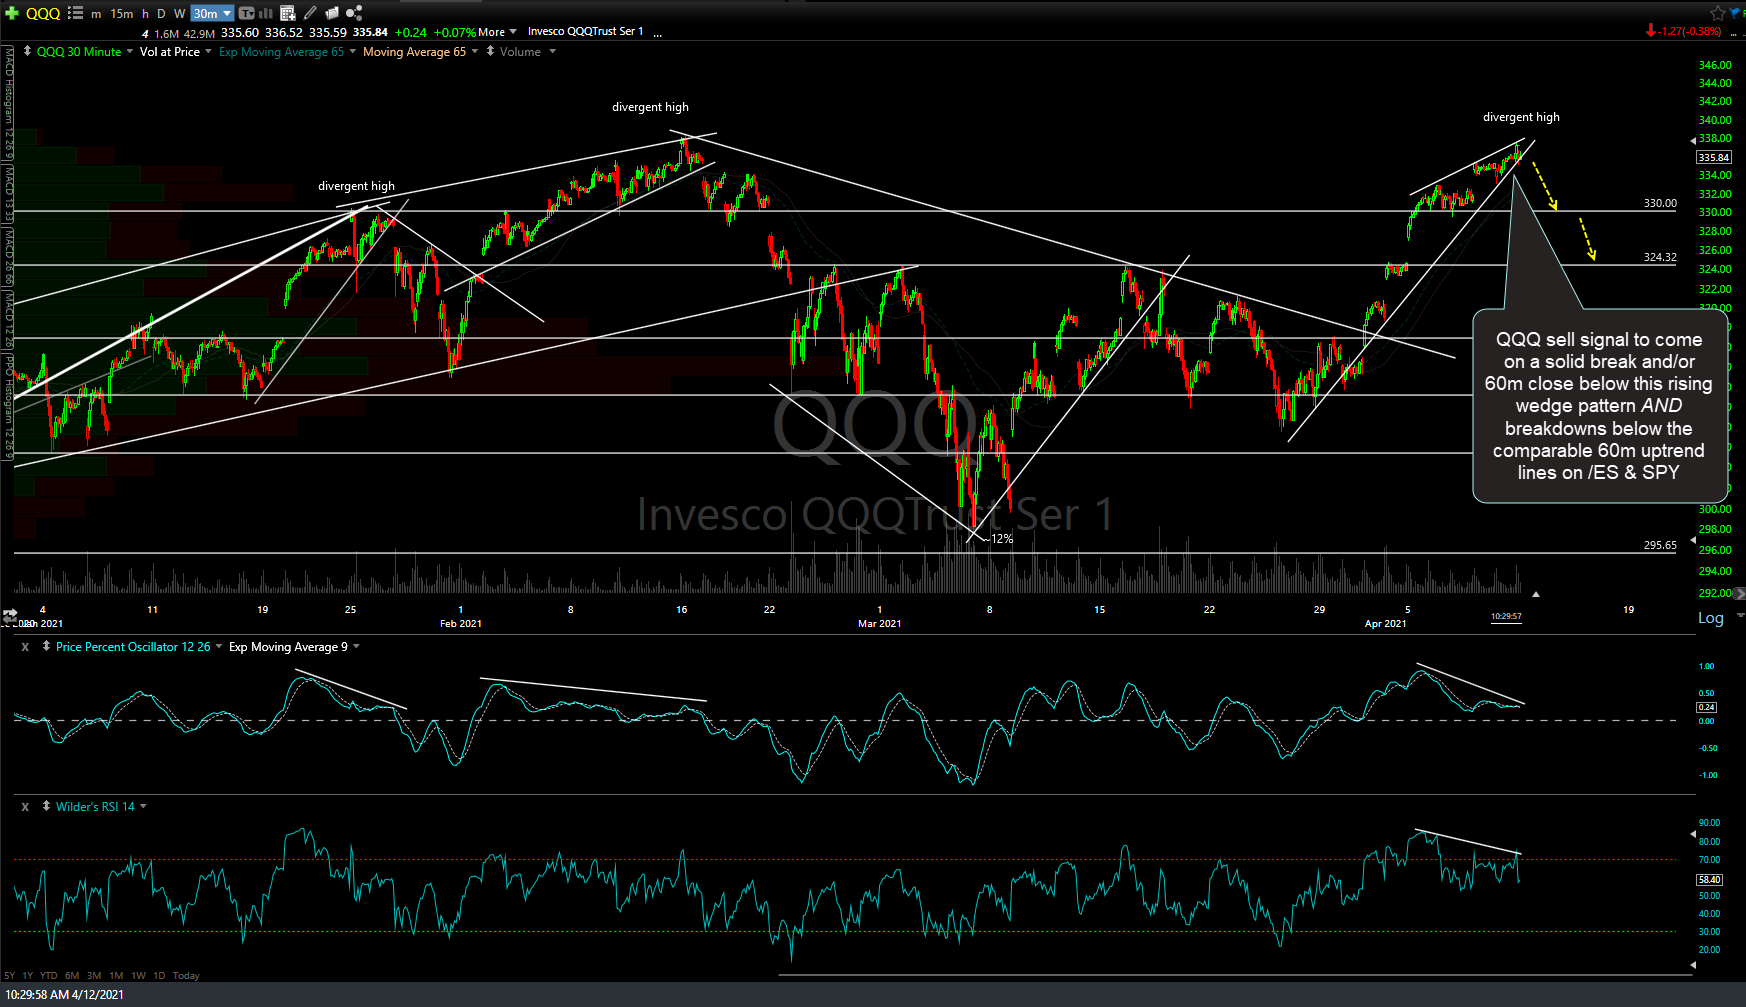
QQQ 60m April 12th
/NQ remains below the 60-minute uptrend line. Blue dotted lines show potential backtest scenario although no sell signal until/unless we get solid breakdowns on /ES & SPY which remains above trend for now.

NQ 60m April 12th
SPY sell signal to come on a solid break and/or 60-minute close below the uptrend line/rising wedge pattern with a minimum target of a backtest of the April 5th gap.
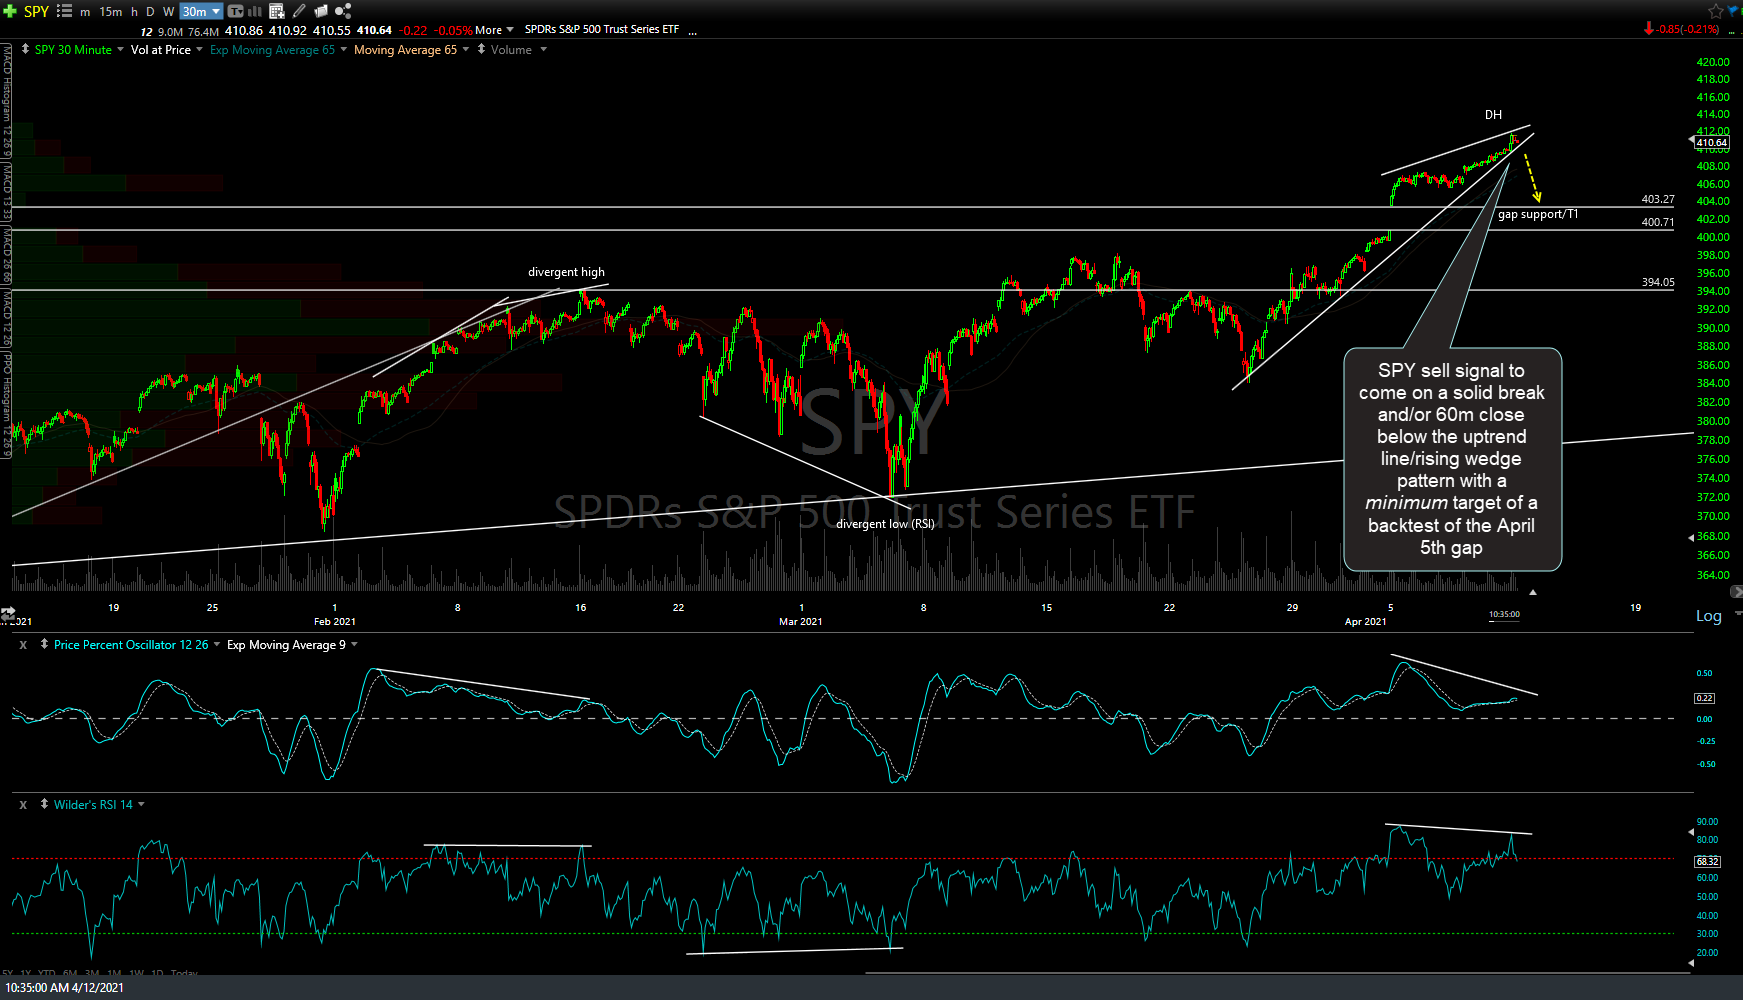
SPY 60m April 12th
/ES remains above trend with a sell signal still to come on a solid break and/or 60-minute close below the uptrend line (alternative but intersecting trendlines shown).
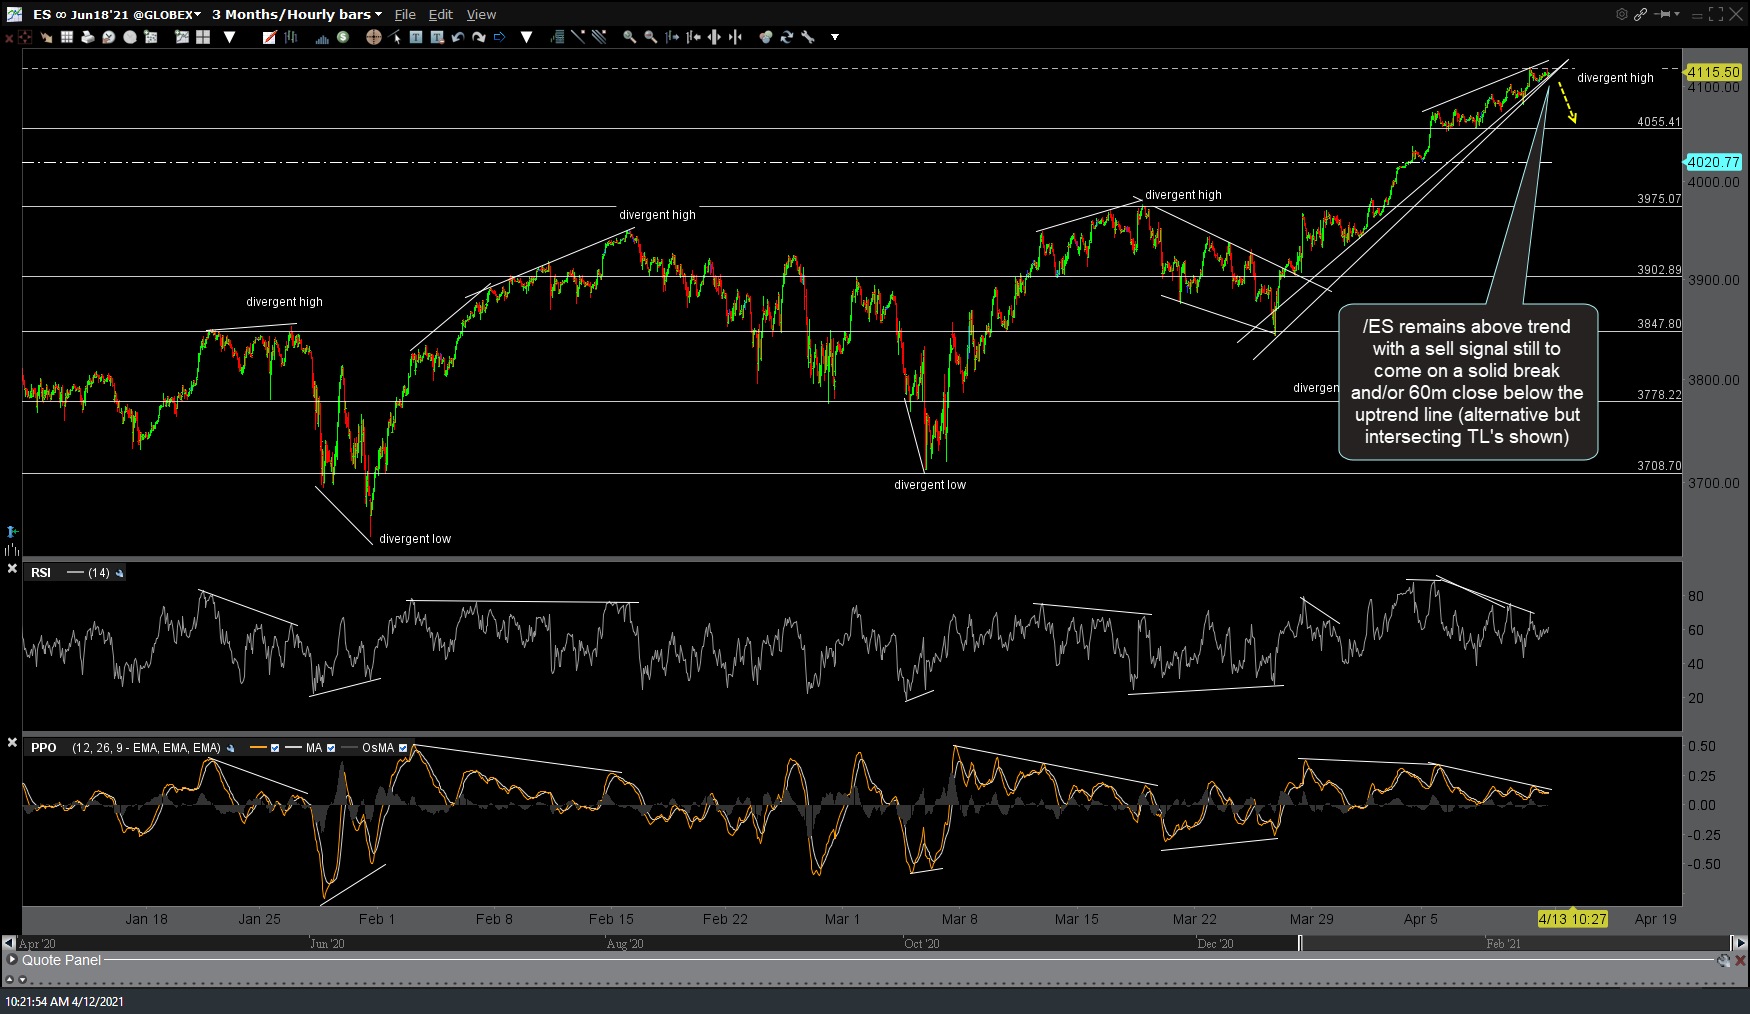
ES 60m April 12th