
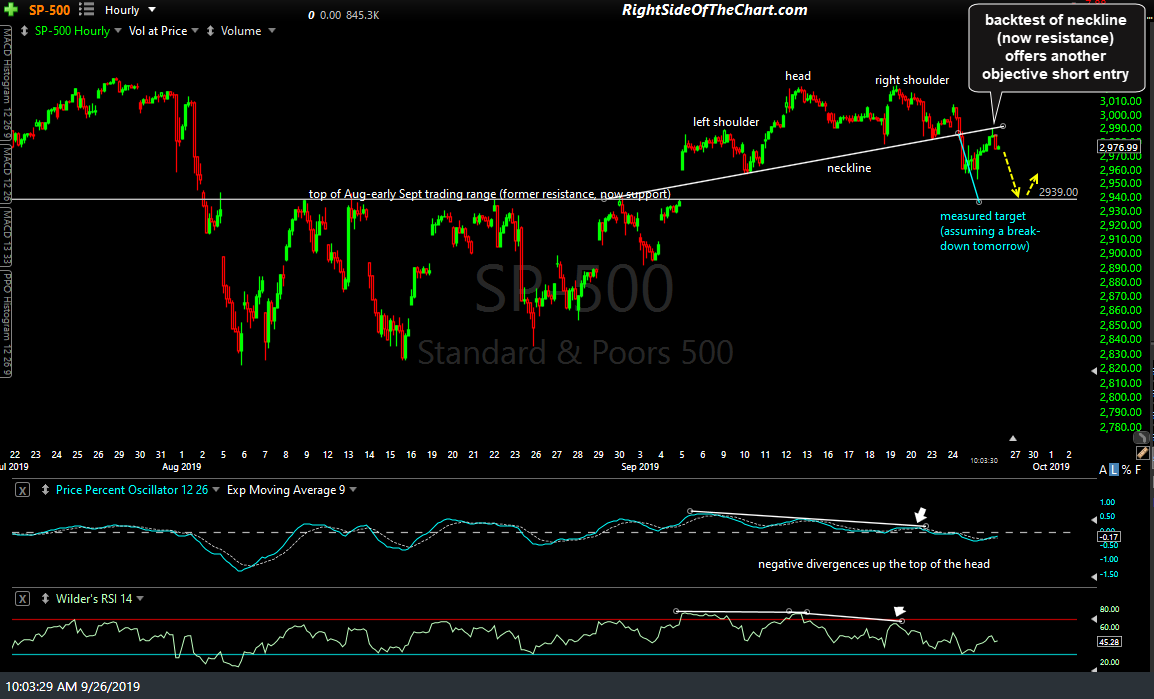
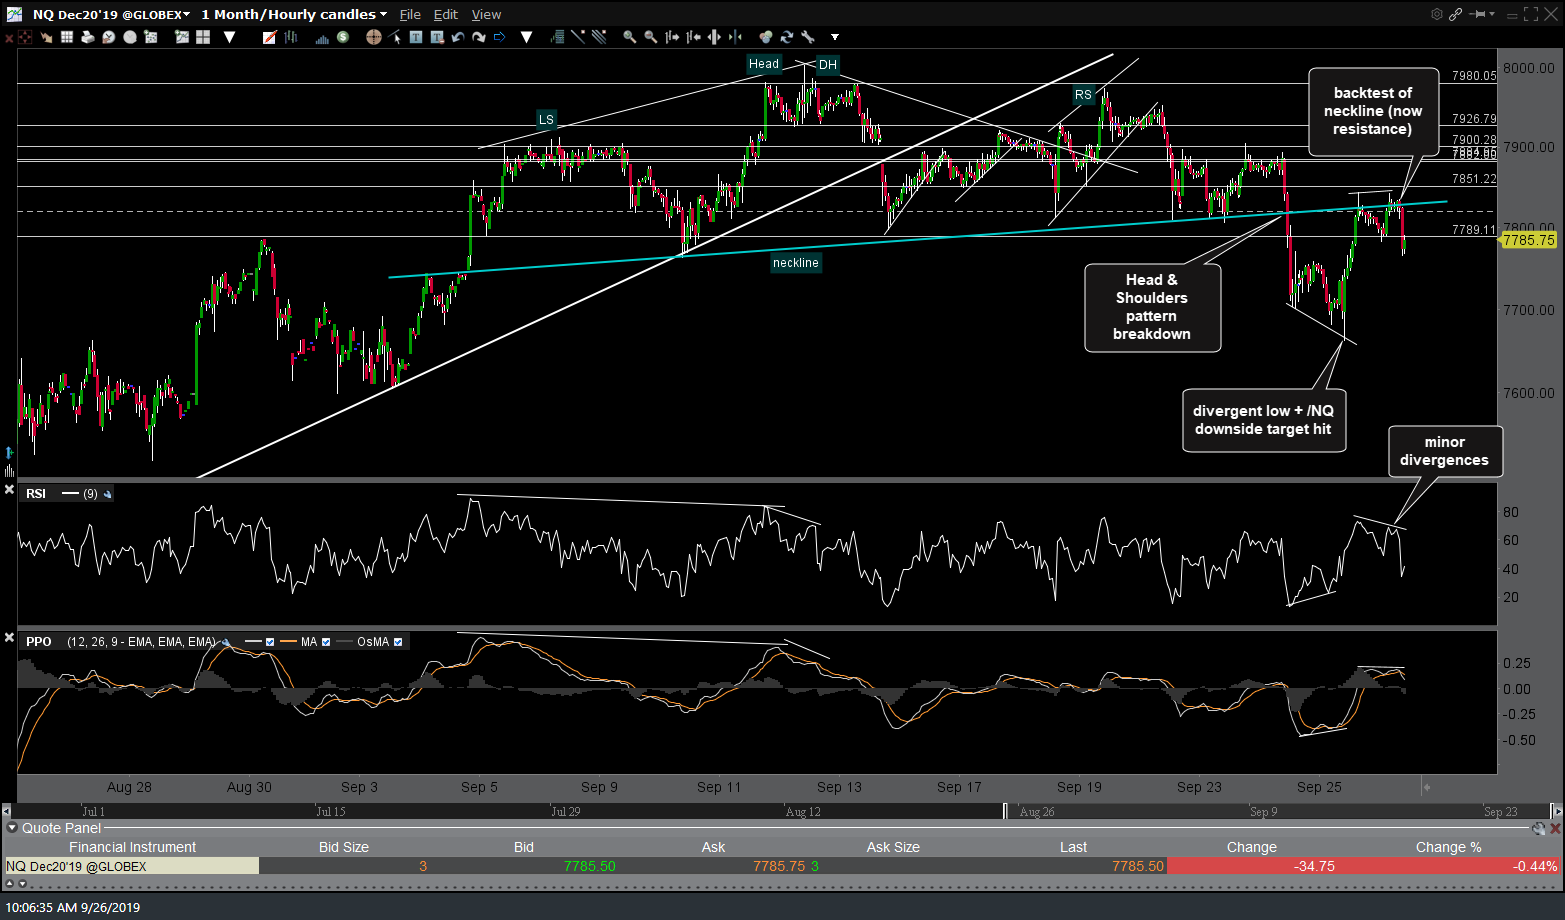
The previously highlighted Head & Shoulders topping patterns on the 60-minute charts of $SPX (S&P 500) and /NQ (Nasdaq 100 futures) we both backtested with impulsive rejections off the necklines (former support, now resistance levels) on both. Both of those backtests coindiced with the failure at the minor downtrend lines that were highlighted in yesterday’s closing market wrap video & again earlier today. (gallery chart images below will not appear on susbcriber email notification but may be viewed on the site)
-

- $SPX 60m Sept 26th
-

- NQ 60m 2 Sept 26th
As such, any solid break above today’s highs would be near-term bullish while a solid break below the 7760 support in /NQ as well as other nearby support levels on the major stock indexes could open the door to additional downside. I’m thinking somewhere along these lines: A bounce off this 7760 support (as posted earlier in the comment section below this post) followed by more downside with some minor zigs & zags along the way.
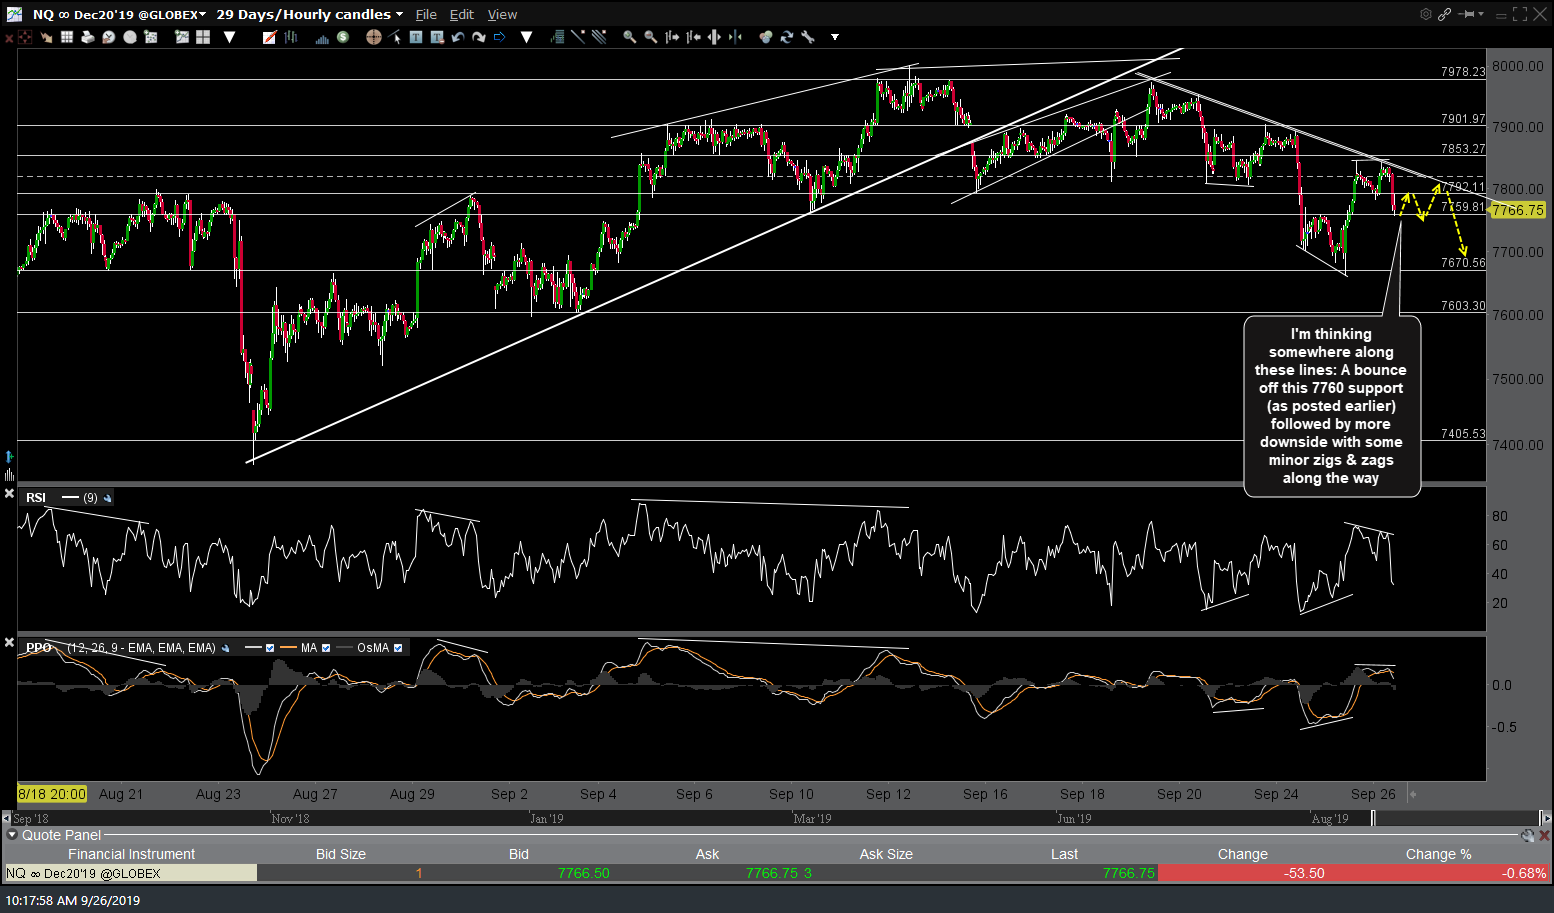
NQ 60m 3 Sept 26th