
There are a lot of moving parts & significant technical levels & developments to watch that could play out for the next major trends in gold as well as the US Dollar & Euro so let me start with the bigger picture (longer-term outlook & my preferred scenario) followed by some updates on the near-term developments & outlook for the US Dollar & Euro, both of which are likely to have an impact on the price of gold.
Let’s start with a visual to illustrate the historical inverse relationship between gold & the US Dollar ($USD). The reasoning behind the inverse relationship (one goes up, the other goes down & vice versa) is simple: When the $USD strengthens, it takes fewer dollars to purchase one ounce of gold & when the Dollar falls, it takes more Dollars to buy one ounce of gold. Pretty simple & straightforward although there are other factors, such as supply & demand forces, that affect the price of gold as well.
This 12-year chart shows the inverse correlation (shown here as a positive correlation via UDN, the inverse/bearish $USD ETN) between the $USD and gold. Make sure to focus on the TREND and inflection points of each, not the relative distance as they are not priced 1:1. The period since the sharp stock market meltdown in Q4 ’18 (which I & apparently many others, looking at the price action of gold in the chart below, consider a “shot across the bow” for the stock market) highlights the unusual disconnect between the inverse relationship between gold & the $USD which was the result of an extremely powerful flight-to-safety bid beneath gold which has overwhelmed the effects of a rising Dollar. I shudder when I think what the 36% rally in gold since the start of Q4 2018 would have looked like if it occurred in conjunction with the tailwind of a falling US Dollar instead of the headwind of a strong rally in the dollar over that entire period as I imagine it would have been nothing short of explosive (or even more explosive, to be accurate).
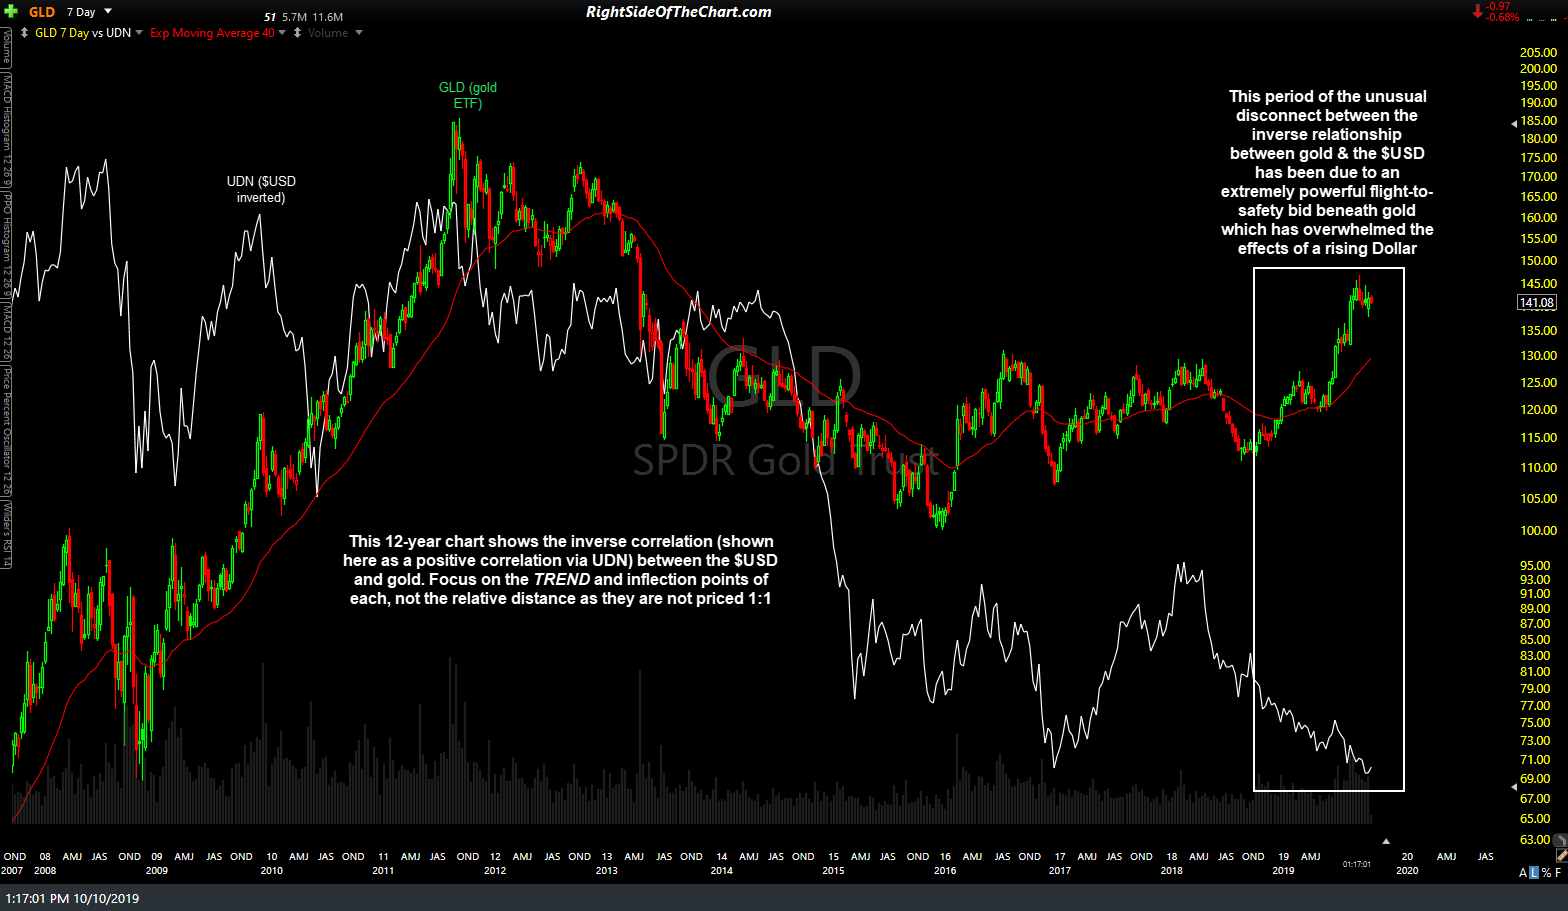
GLD vs UDN 12-yr Oct 10th
Now that the fundamental reasoning & history of a falling dollar being a net bullish factor for gold has been established, let’s take a look at the charts of the US Dollar along with the Euro, which is by far, the largest component of the US Dollar Index at an extremely top-heavy weighting of 57.6%. (i.e.- the Dollar & Euro trading with a nearly perfect inverse correlation). On the 10-year weekly chart below, the EUR/USD still appears poised for a major trend reversal with a buy signal to come on solid break & weekly close above the minor downtrend line/price channel that has formed just above the bullish falling wedge pattern with a solid break above the 1.11125 level likely to confirm the breakout.
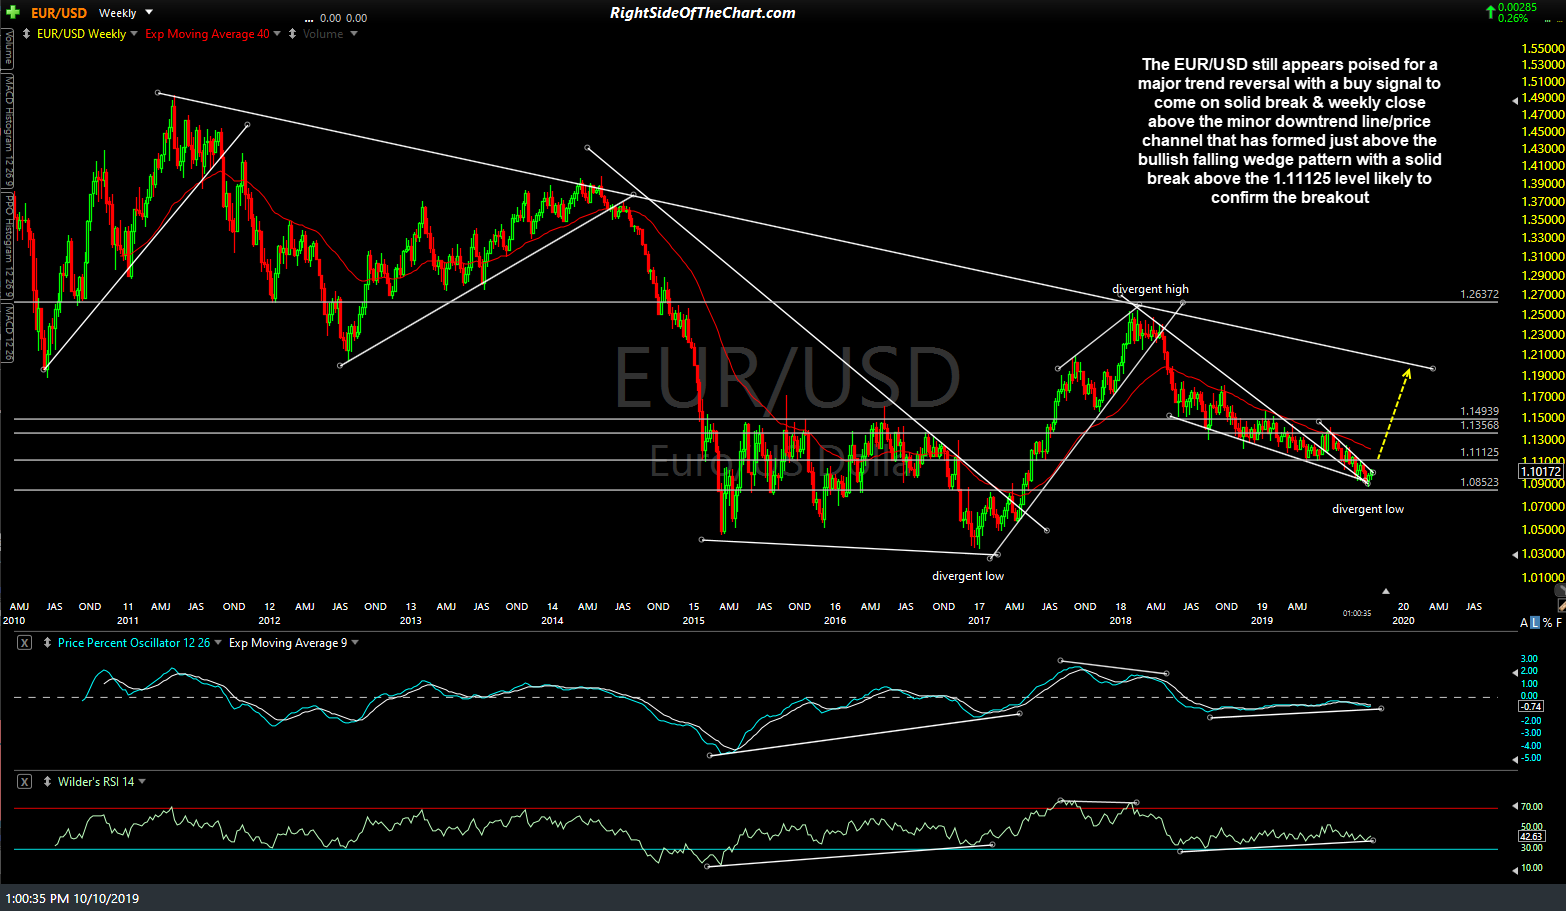
EUR-USD weekly Oct 10th
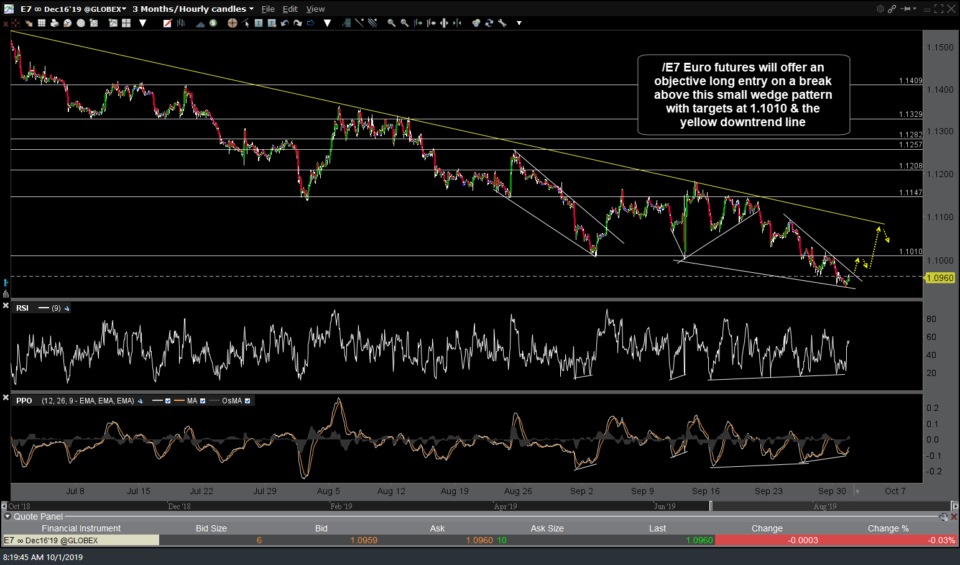
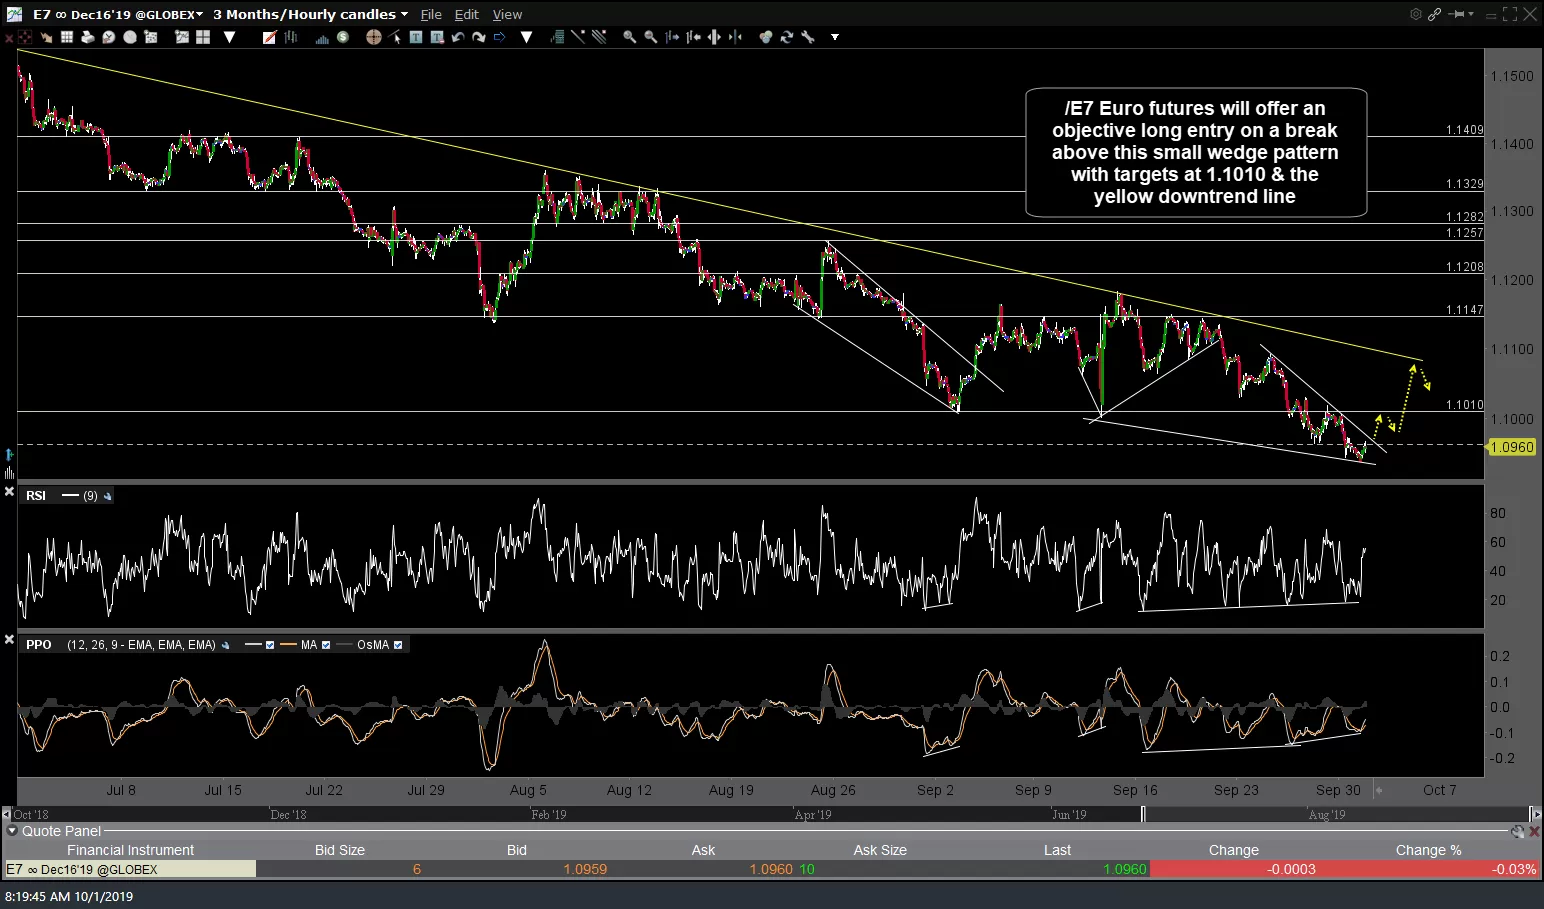
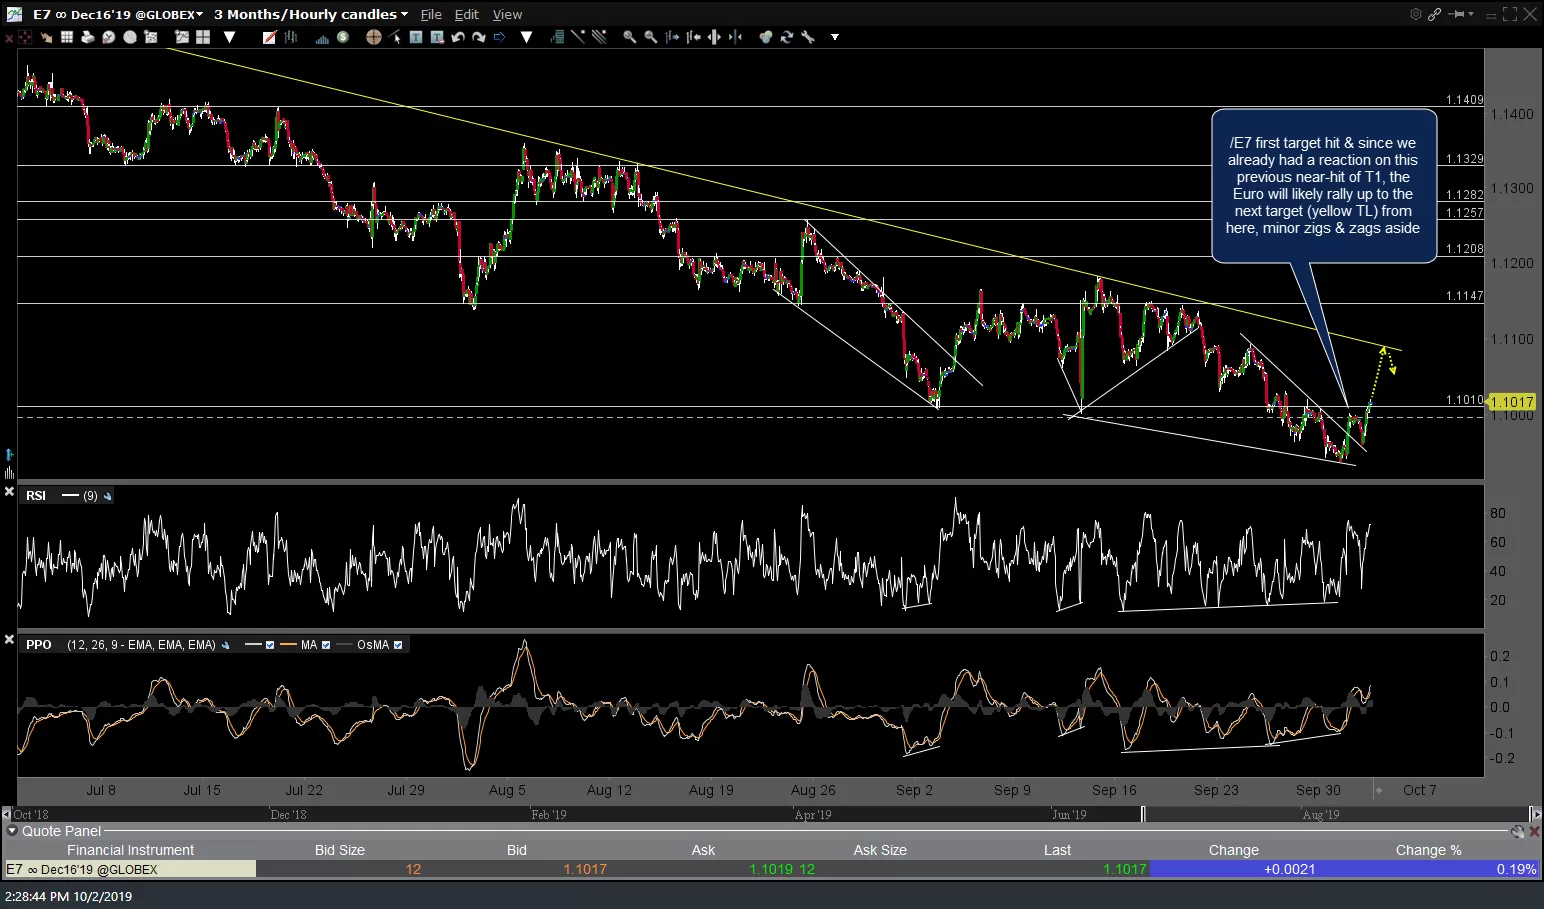
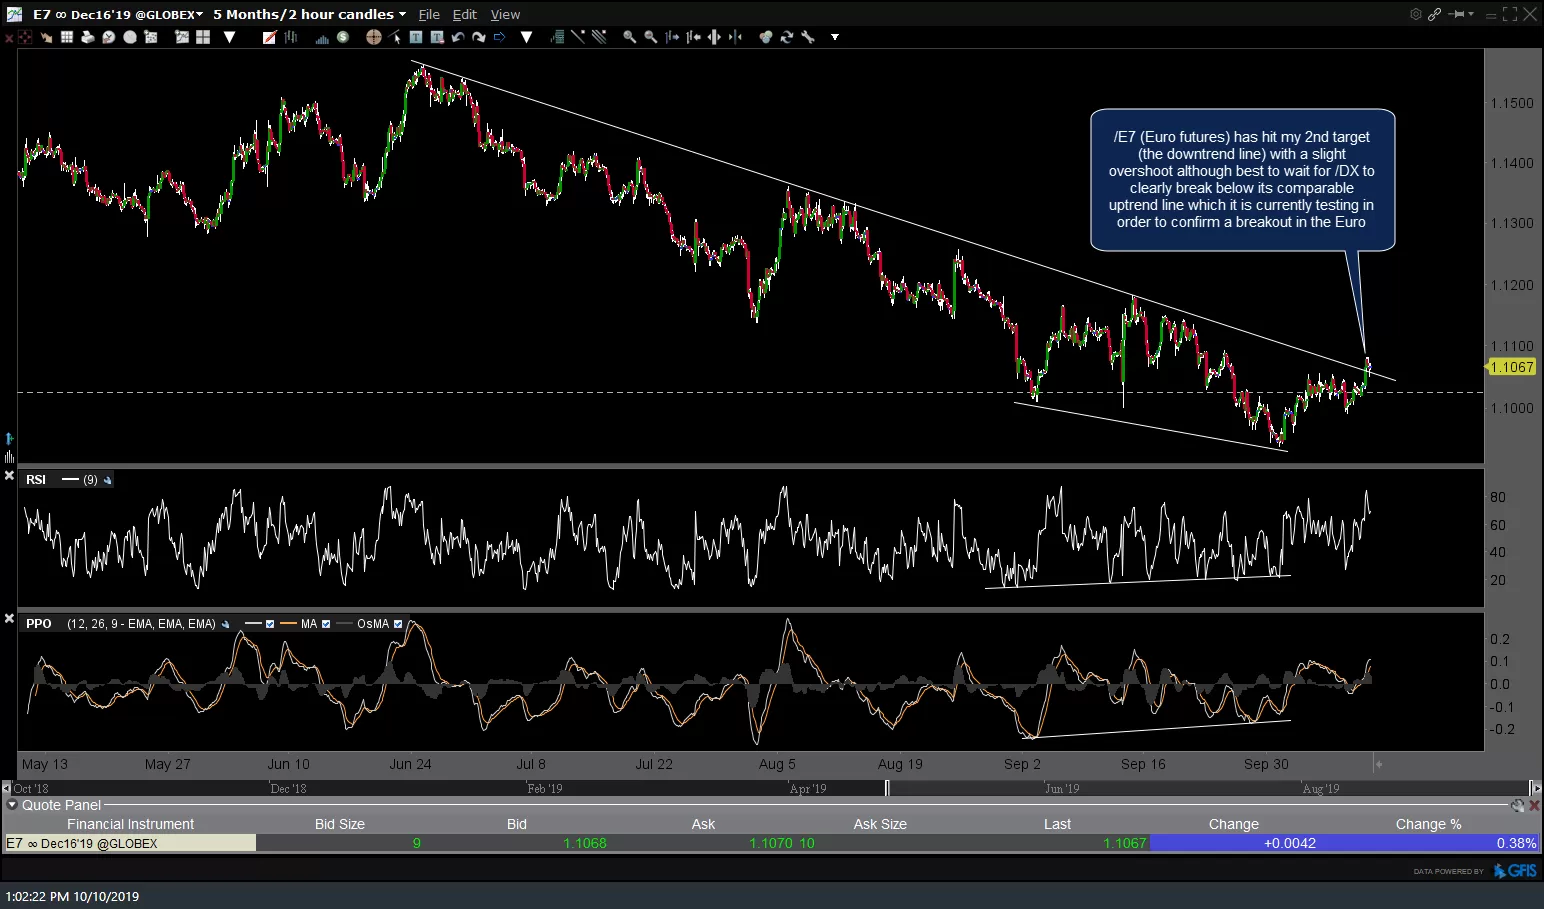
Zooming down to the 60-minute & 120-minute charts of /E7 (Euro futures) & /DX (US Dollar futures) below, /E7 has just hit my 2nd target (the downtrend line) that was recently posted (first few /E7 charts below) with a slight overshoot although best to wait for /DX to clearly break below its comparable uptrend line which it is currently testing in order to confirm a breakout in the Euro.
Click on first gallery chart below to expand, then click on right of each chart to advance to the next expanded image.
-
- E7 60m Oct 1st
-
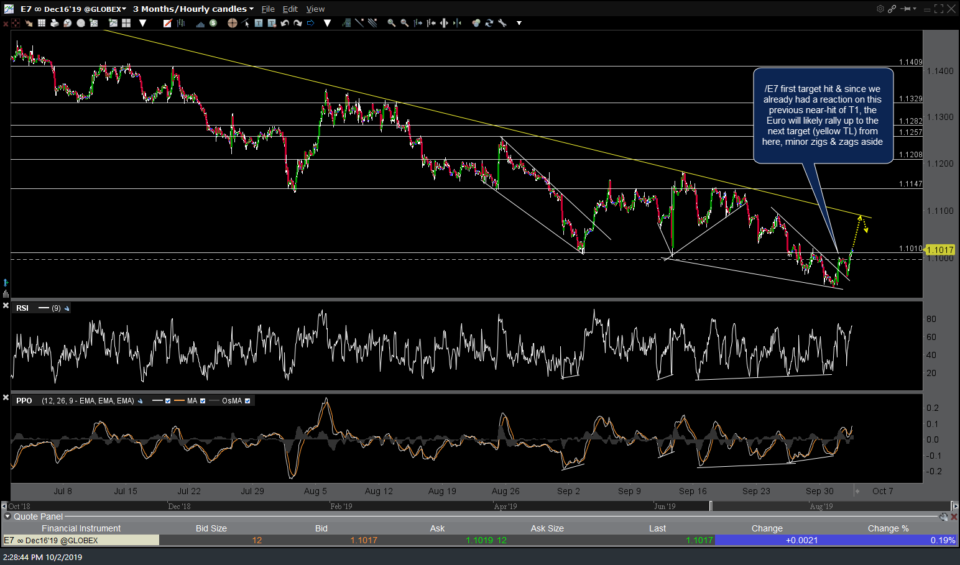
- E7 60m Oct 2nd
-
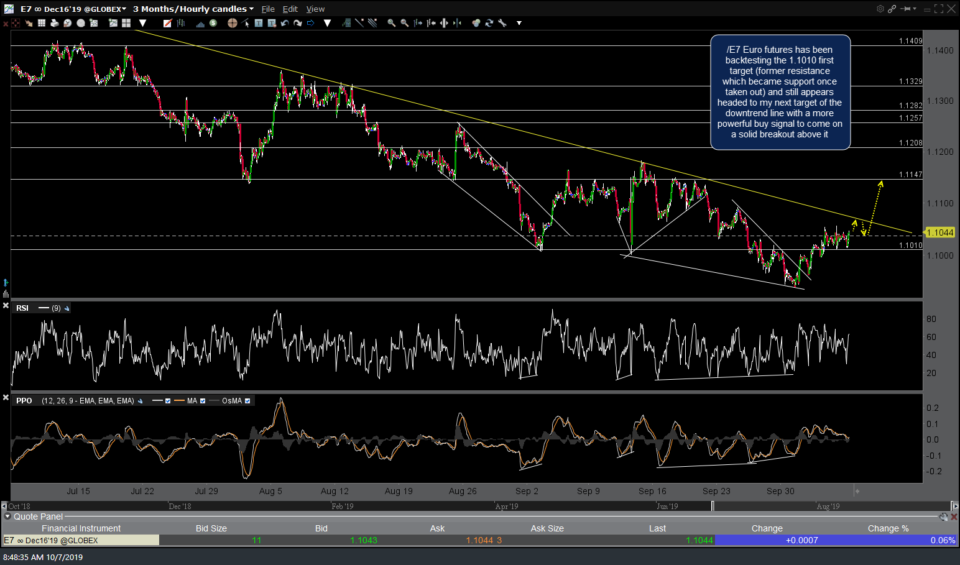
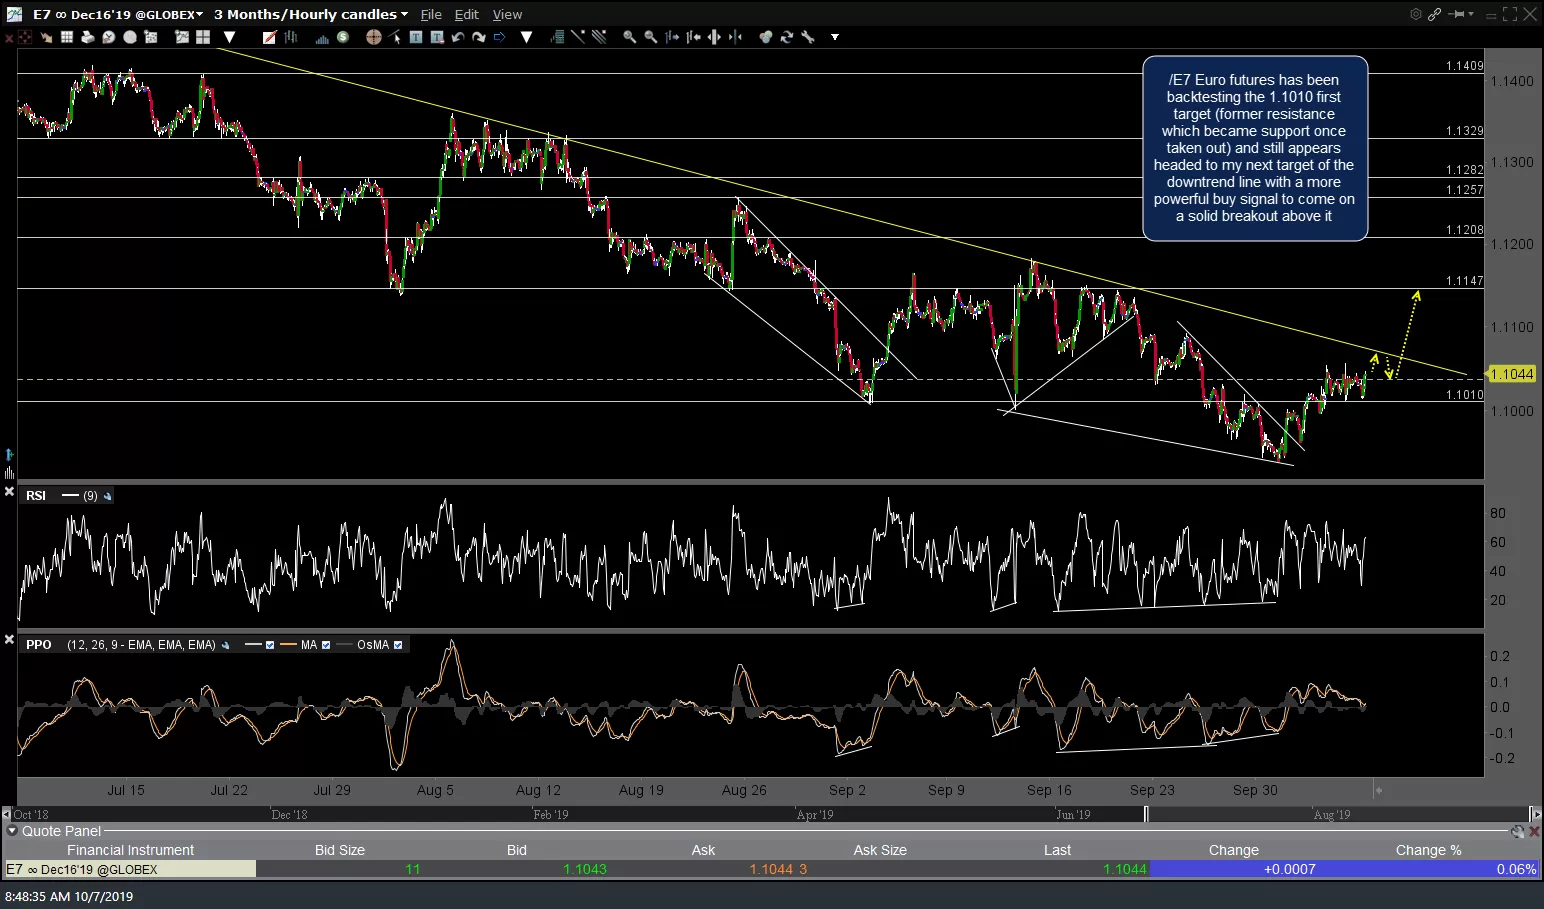
- E7 60m Oct 7th
-

- E7 60m Oct 10th
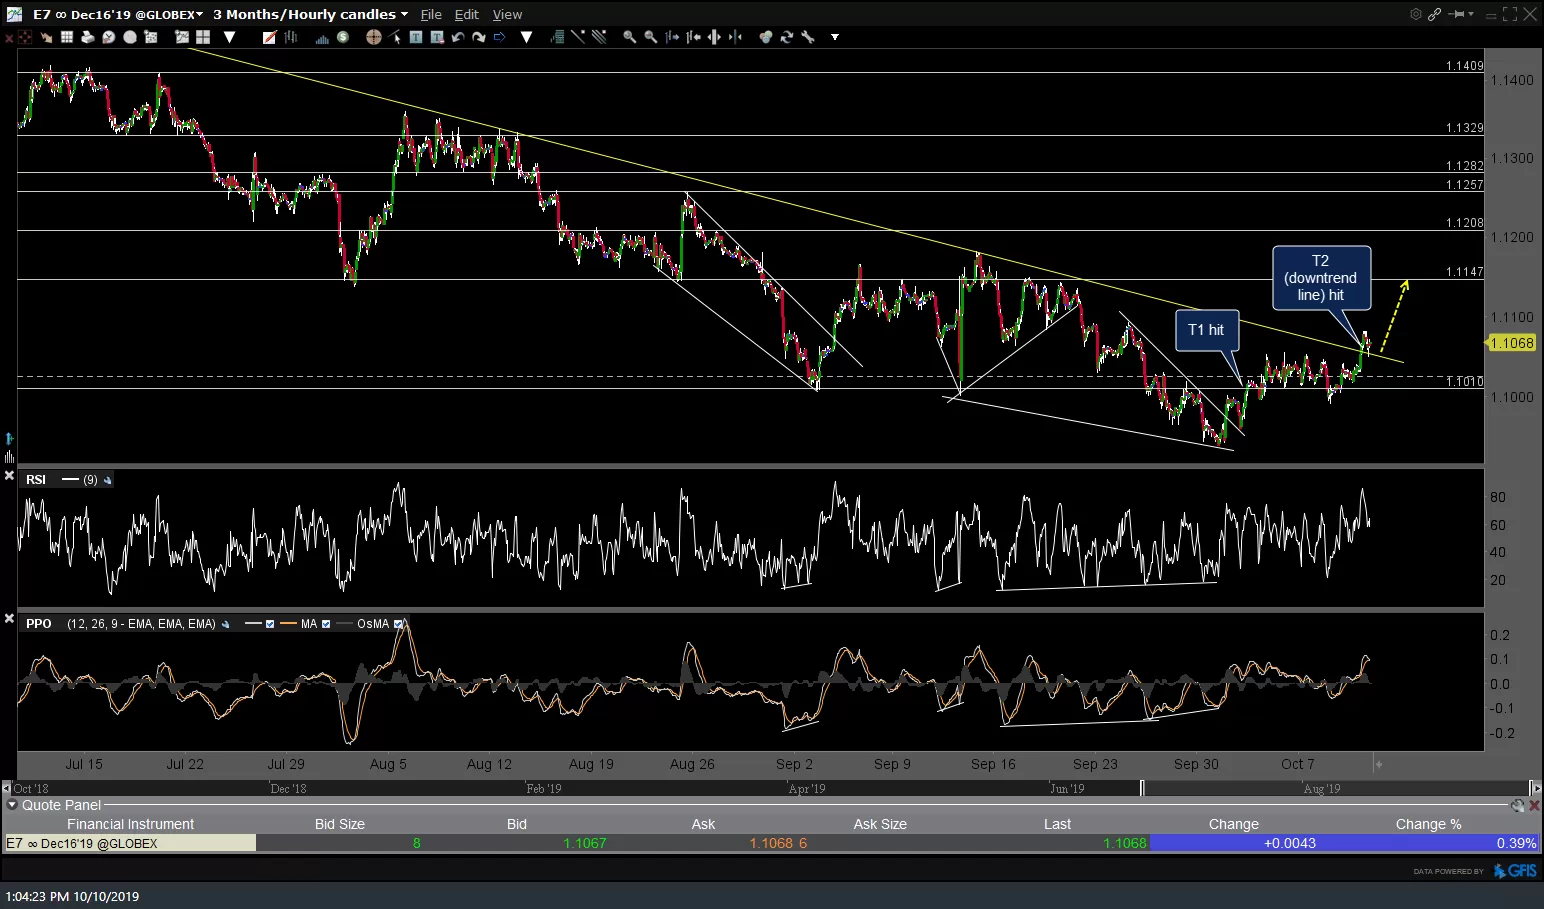
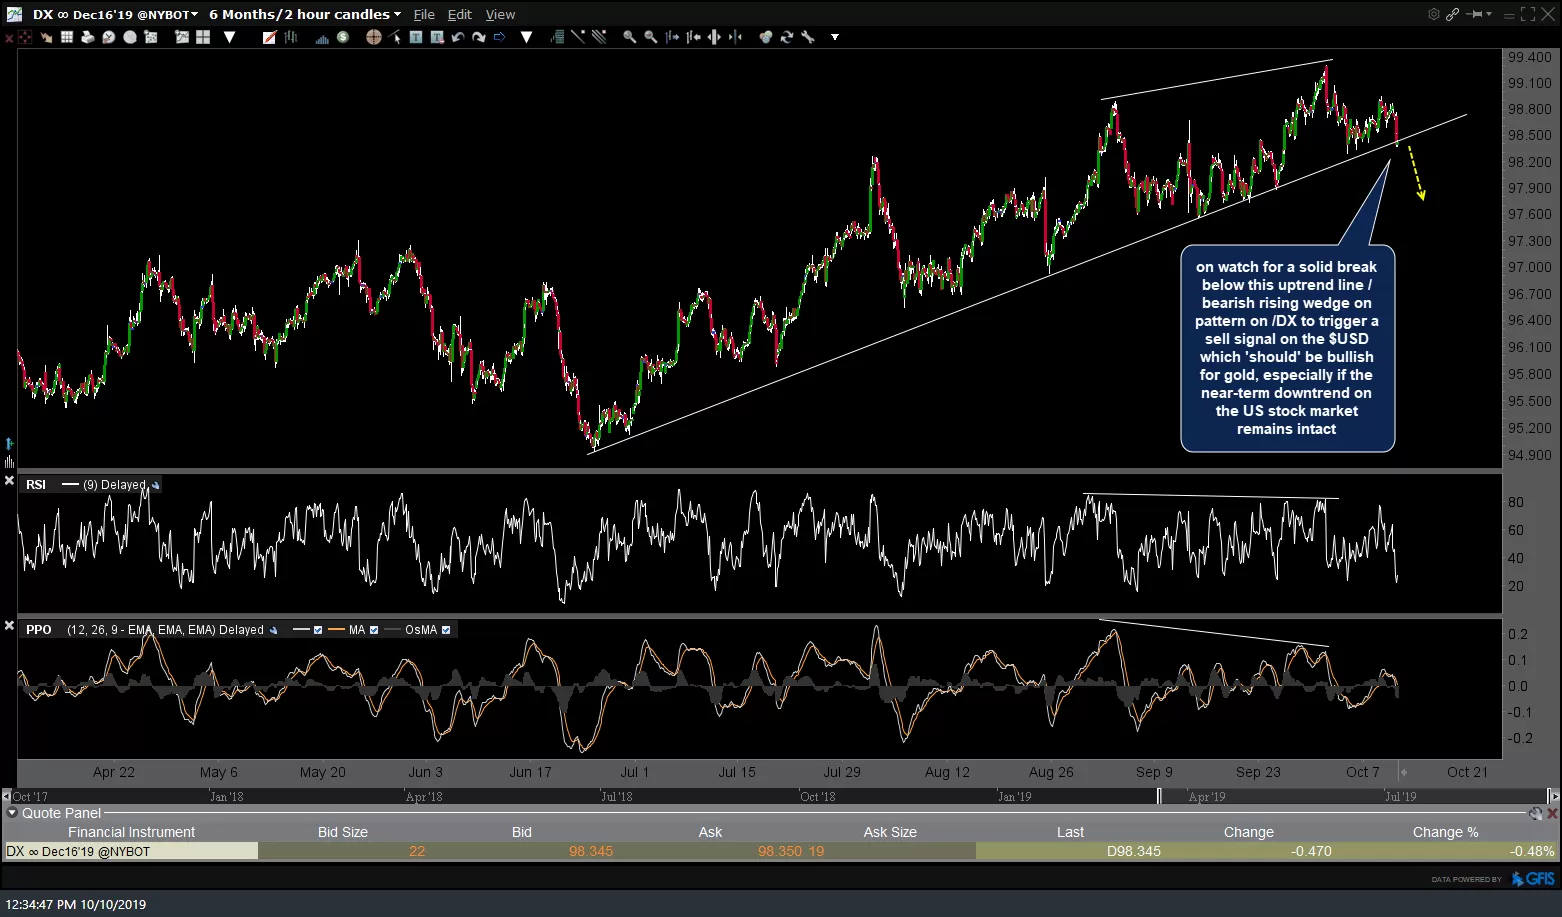
Although /E7 has crossed above the downtrend line off the June 24th highs as shown on the 120-minute chart below, we need to see a solid break below this uptrend line/bearish rising wedge on pattern on /DX ($USD futures) to trigger a sell signal on the $USD which ‘should’ be bullish for gold, especially if the near-term downtrend on the US stock market remains intact. Until & unless /DX makes a solid breakdown, I am considering this breakout on /E7 as a slight overshoot of the trendline & potential whipsaw/false breakout (i.e.- awaiting a breakout/down in both /E7 & /DX).
-
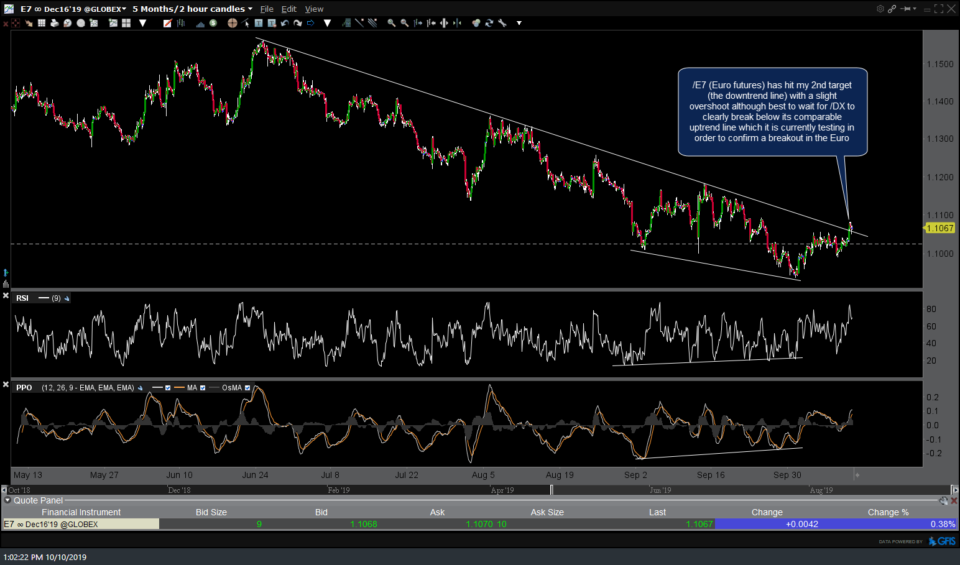
- E7 120-min Oct 10th
-
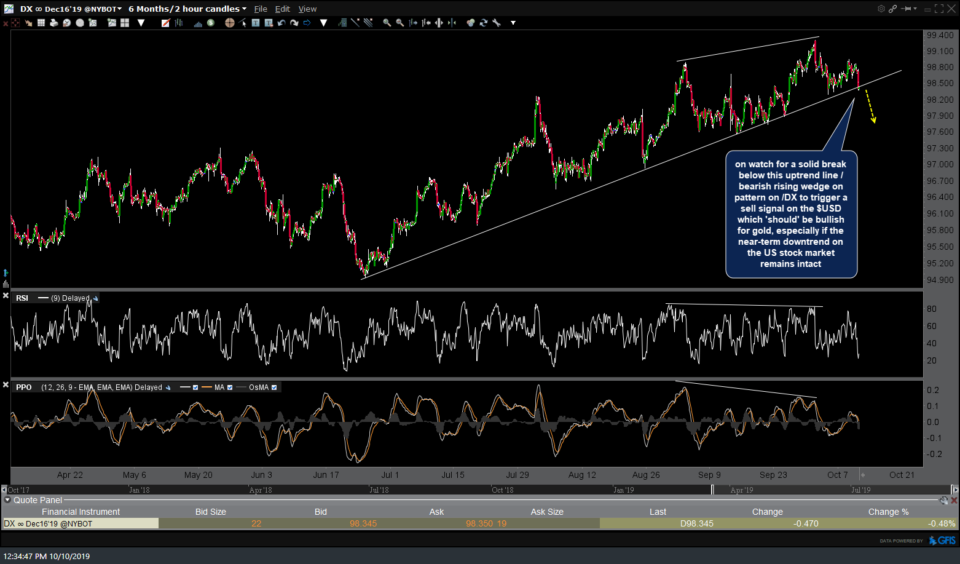
- DX 120m Oct 10th
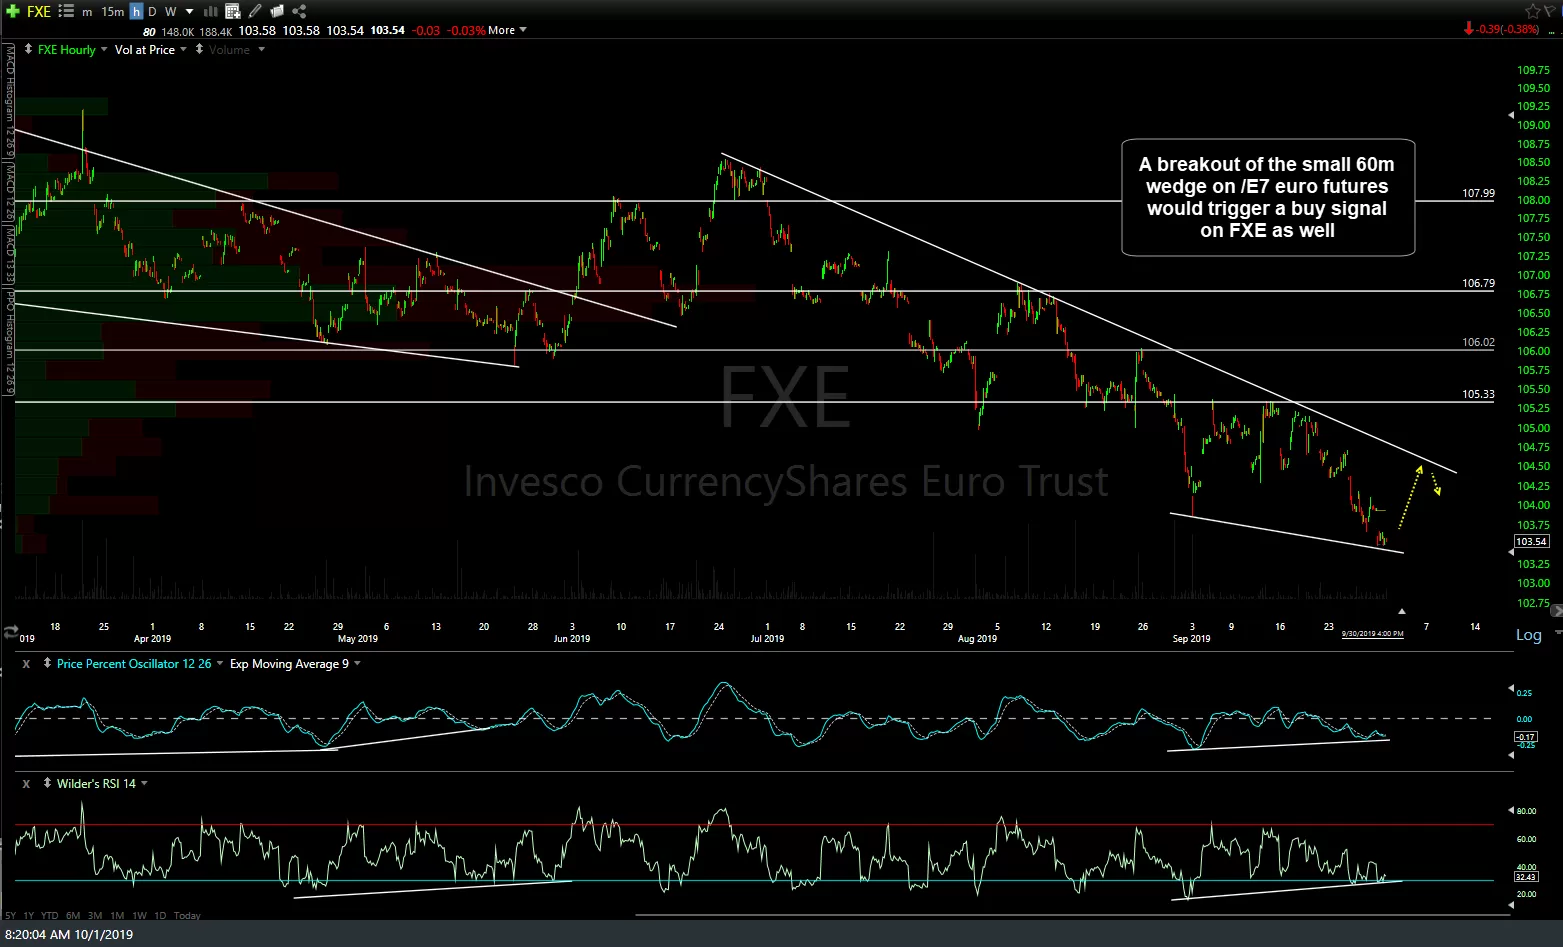
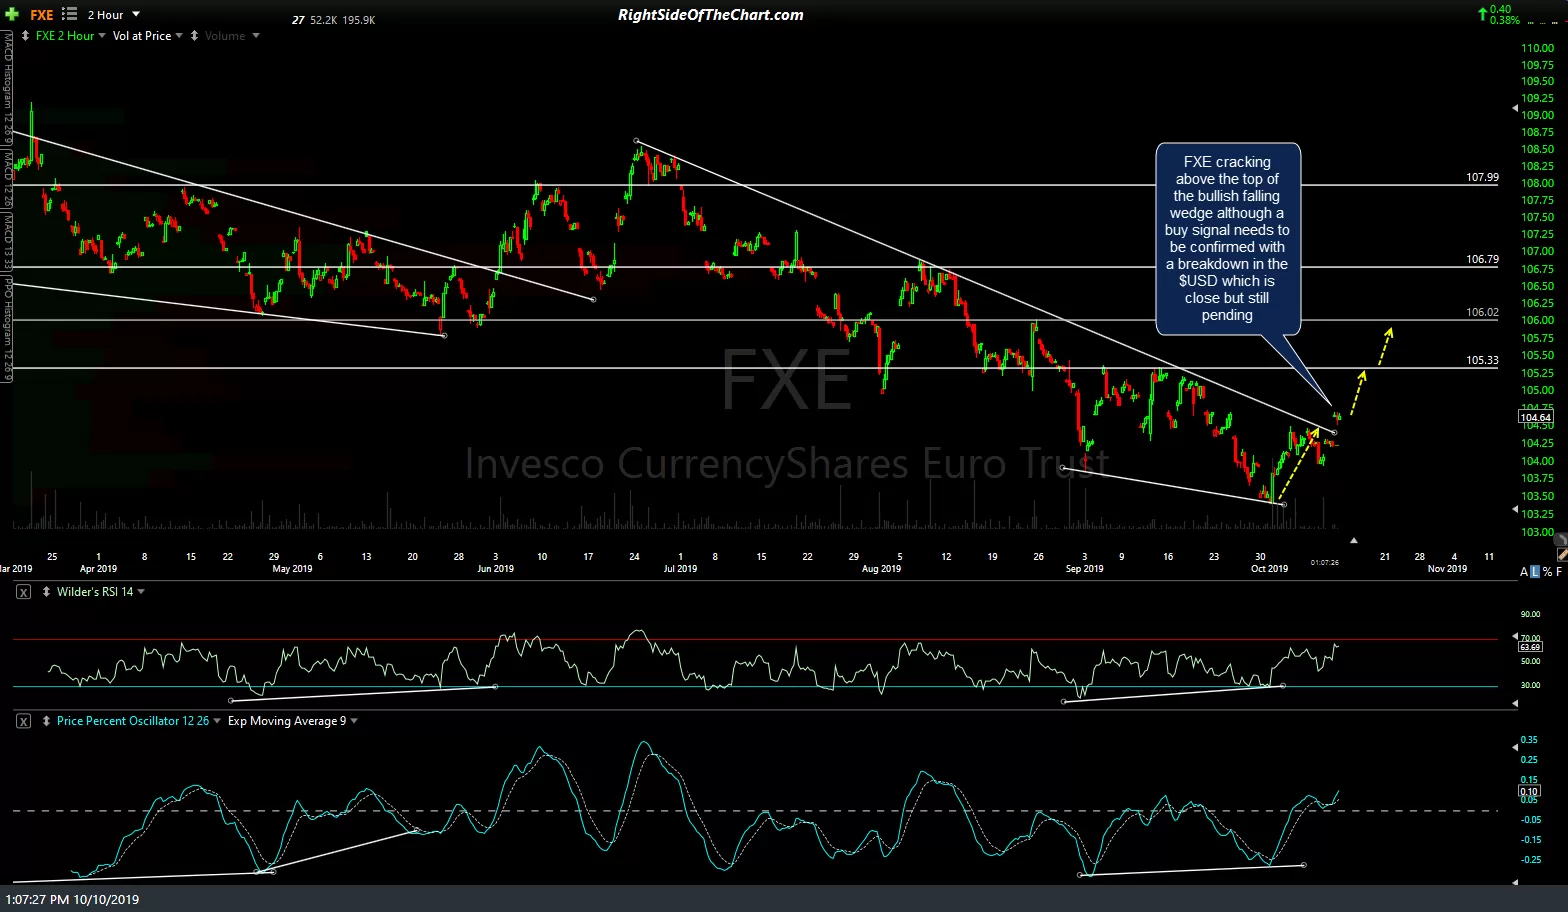
Likewise, FXE (Euro ETN), which is playing out as per the Oct 1st scenario (first chart below) is cracking above the top of the bullish falling wedge although a buy signal needs to be confirmed with a breakdown in the $USD which is close but still pending.
-
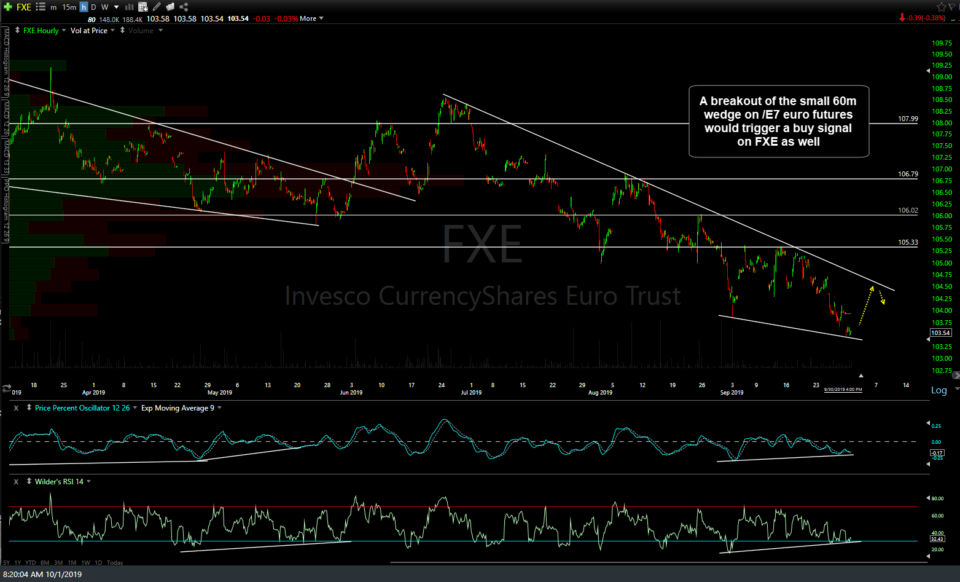
- FXE 60m Oct 1st
-
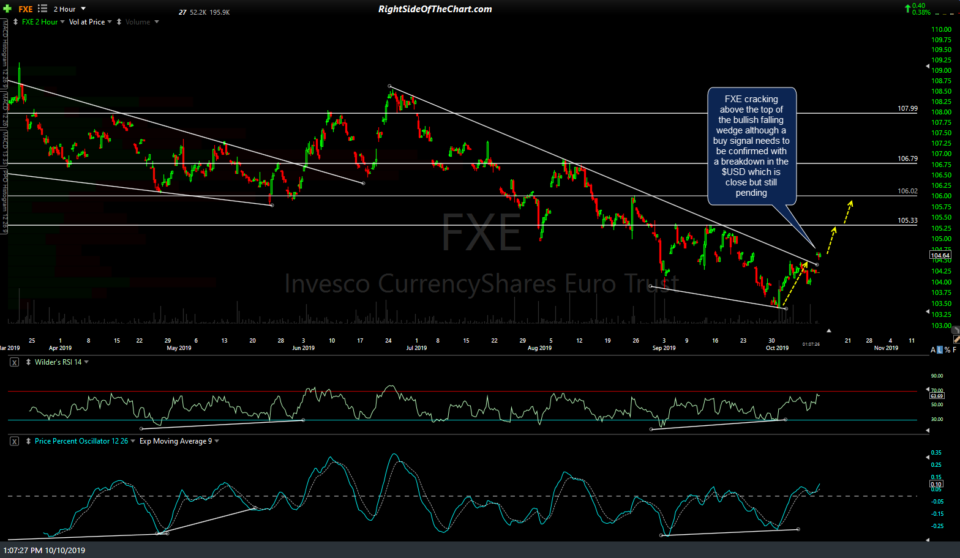
- FXE 120m Oct 10th
With all that being said regarding the US Dollar & Euro, in order for my preferred & quite bullish longer-term scenario for gold (below) to play out, it will most likely (although not absolutely necessary) entail my longer-term bearish outlook for the US stock market playing out as well. One of the most bullish scenarios for gold would be a breakout above the potential bull flag continuation pattern on this 10-year weekly chart of GLD followed by an impulsive leg up to the 173ish long-term target which would mesh with my bearish scenario of a ~30% drop in the stock market.
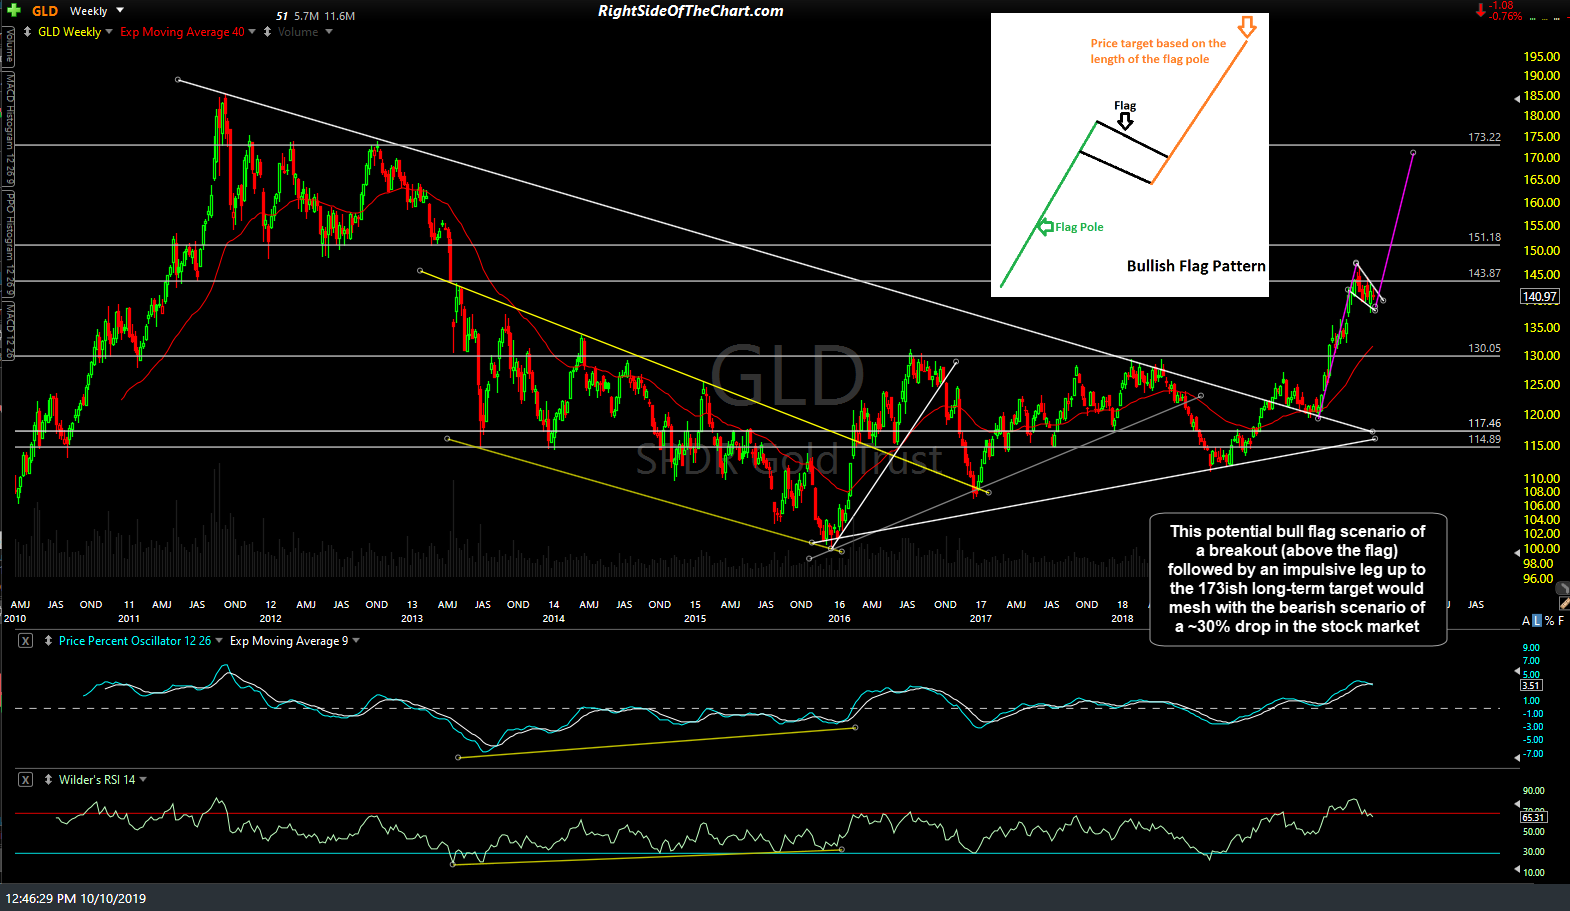
GLD weekly Oct 10th
The 10-year weekly chart of SPY below highlights my initial bear market target for the major stock indexes which remains the top of the 2014-2016 trading range, about 28% below current levels. Should that scenario prove correct, the chances of that longer-term target of 173ish on GLD being hit would be quite high. First things first, of course, and that would be the next major sell signals on the US stock market that are still pending, whether or not the indexes make a marginal new high soon or not.
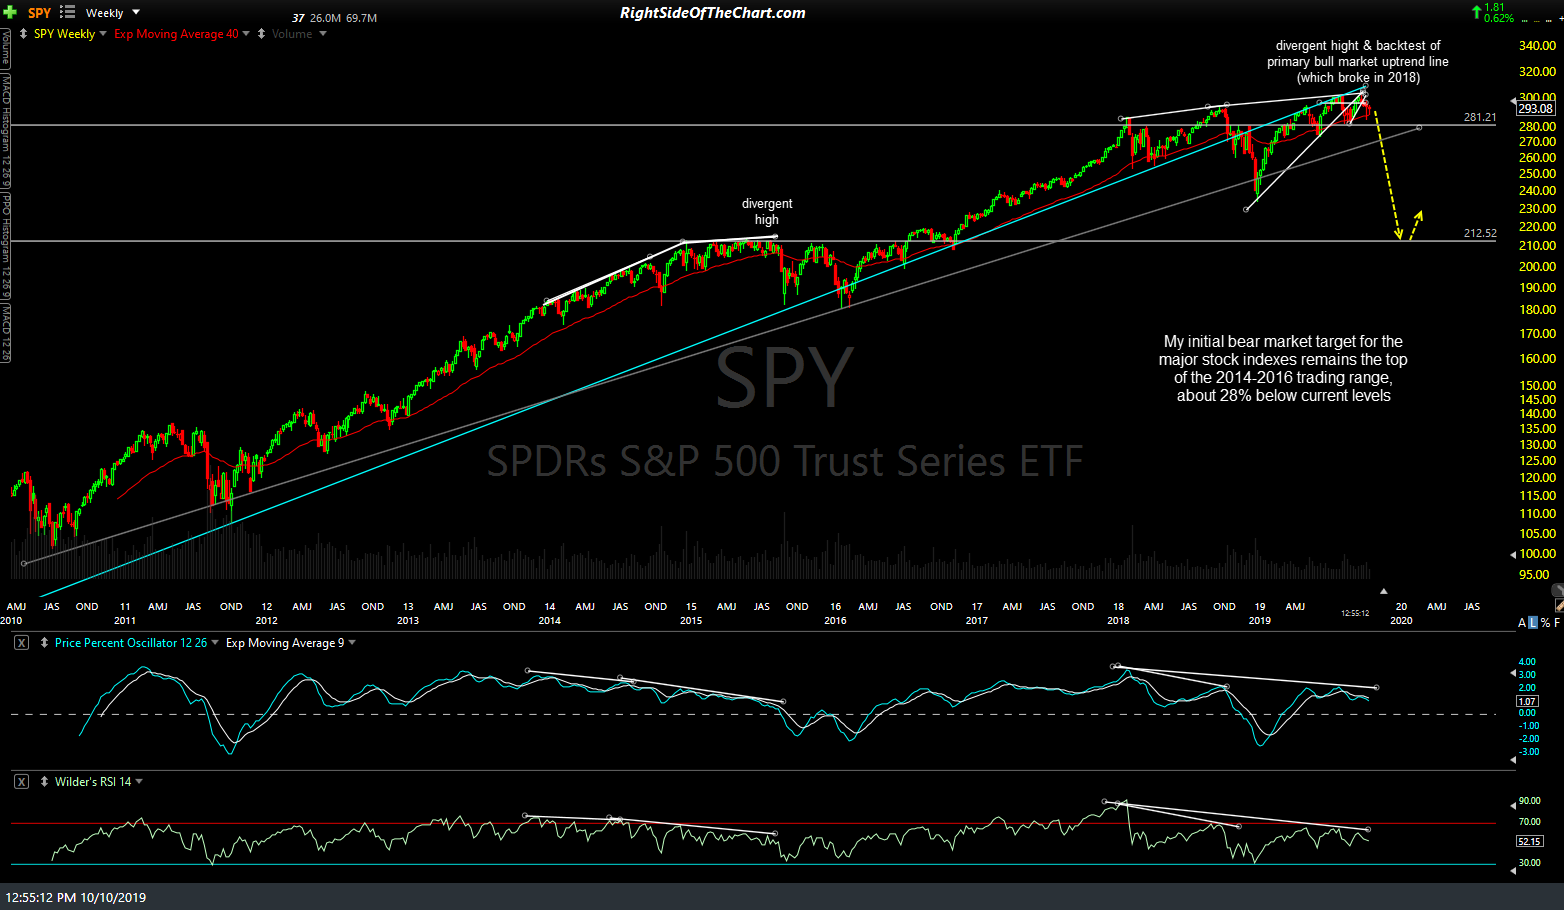
SPY weekly Oct 10th