
/GC gold continues to hold up despite the continued rally in equities, trading between the 1490ish resistance & uptrend line support (bullish, if taken out above, bearish below). Previous & updated 60-minute charts below.
-
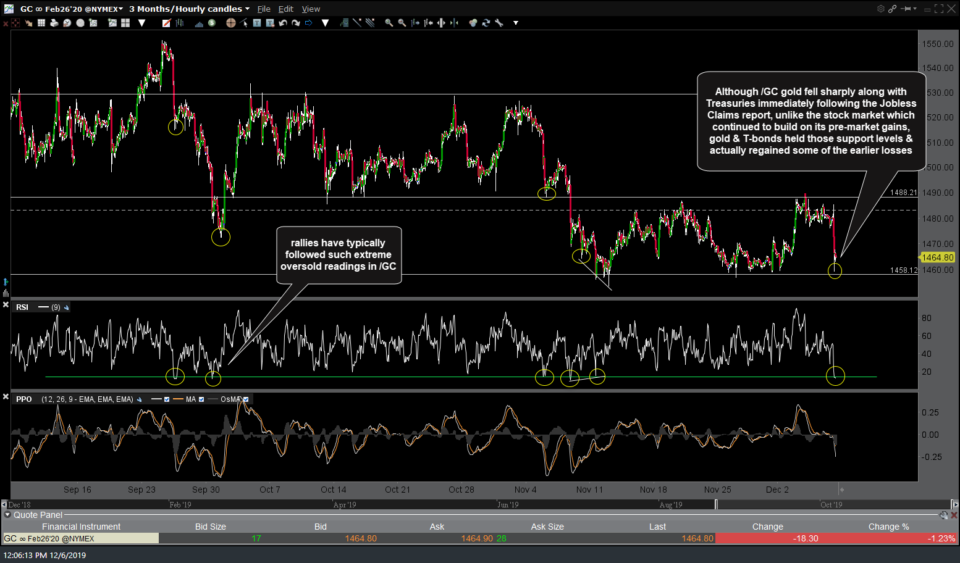
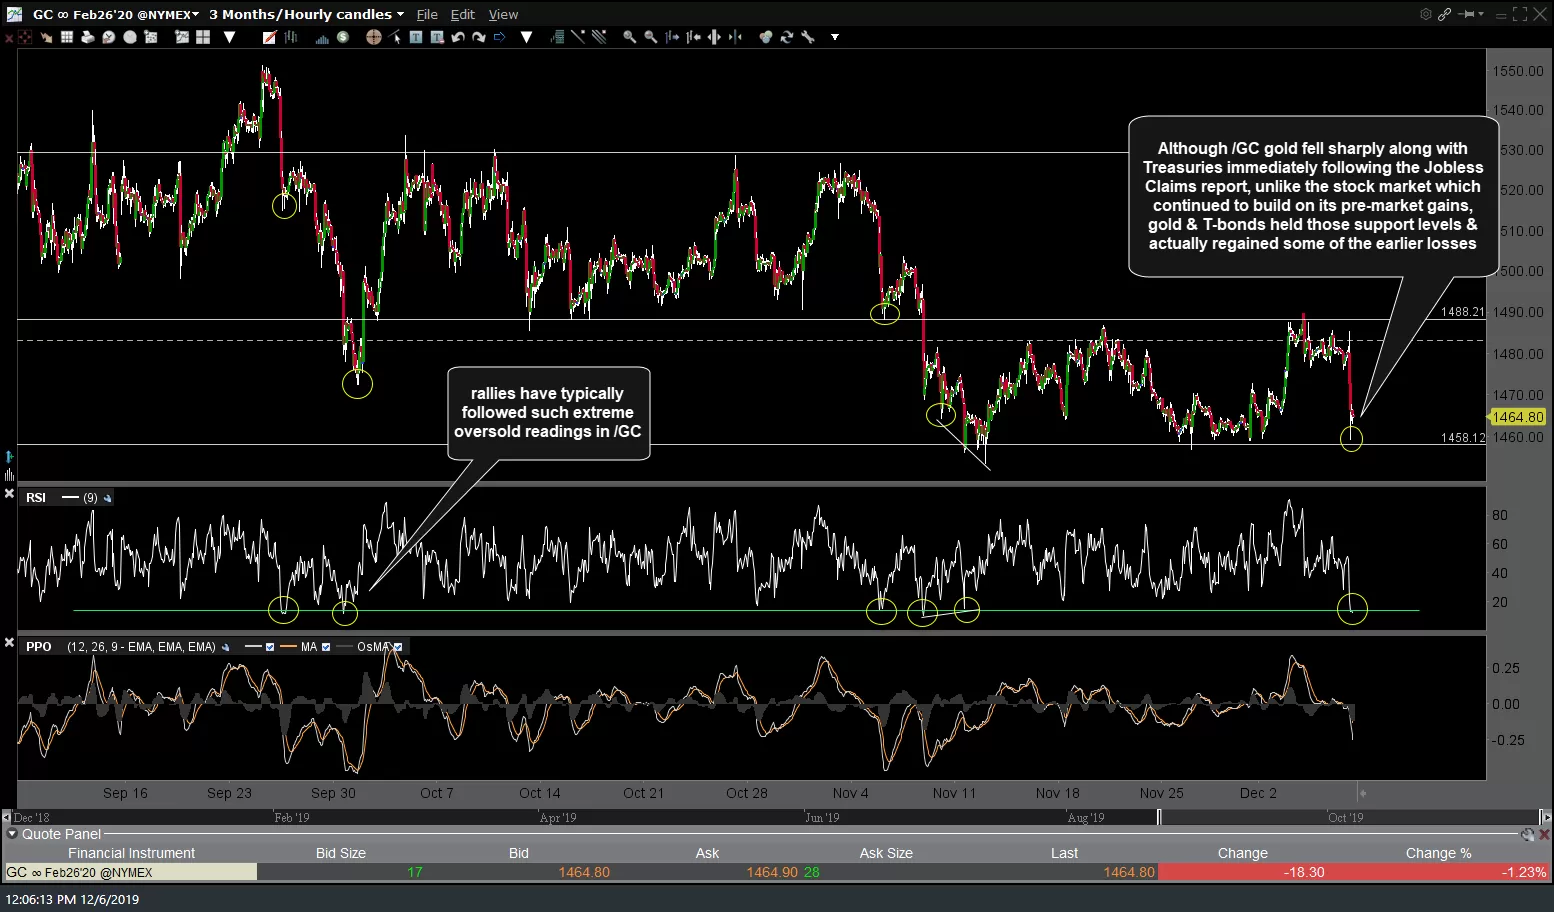
- GC 60m Dec 6th
-
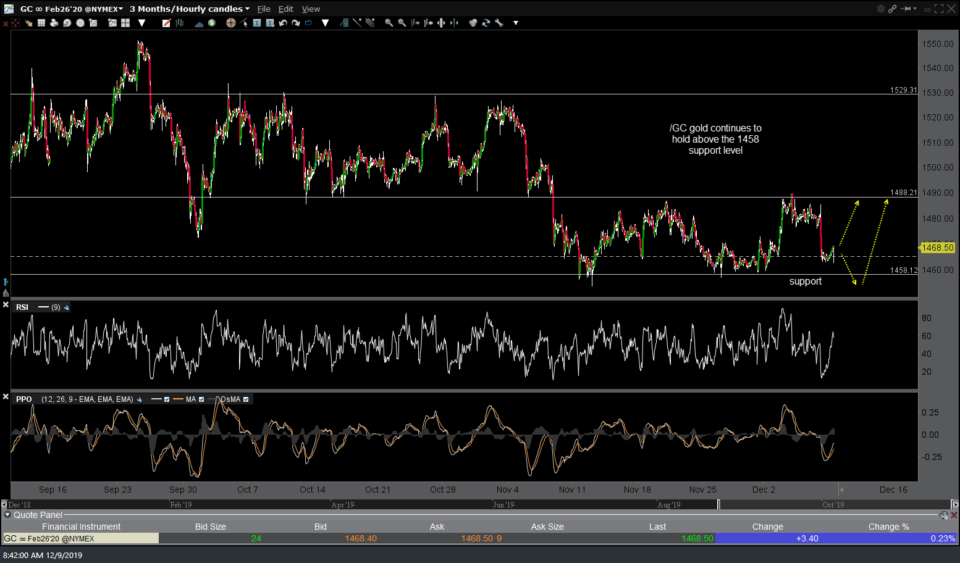
- GC 60m Dec 9th

-
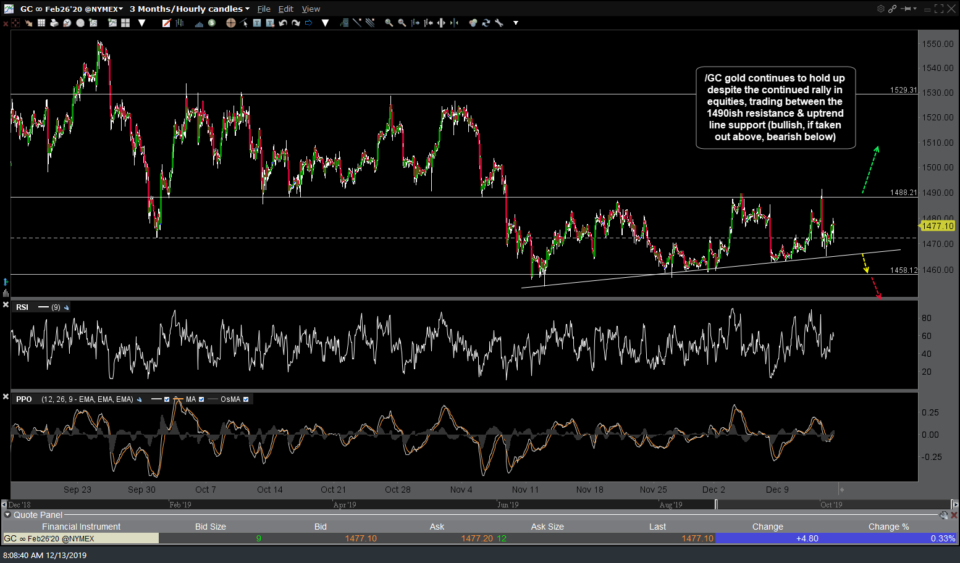
- GC 60m Dec 13th

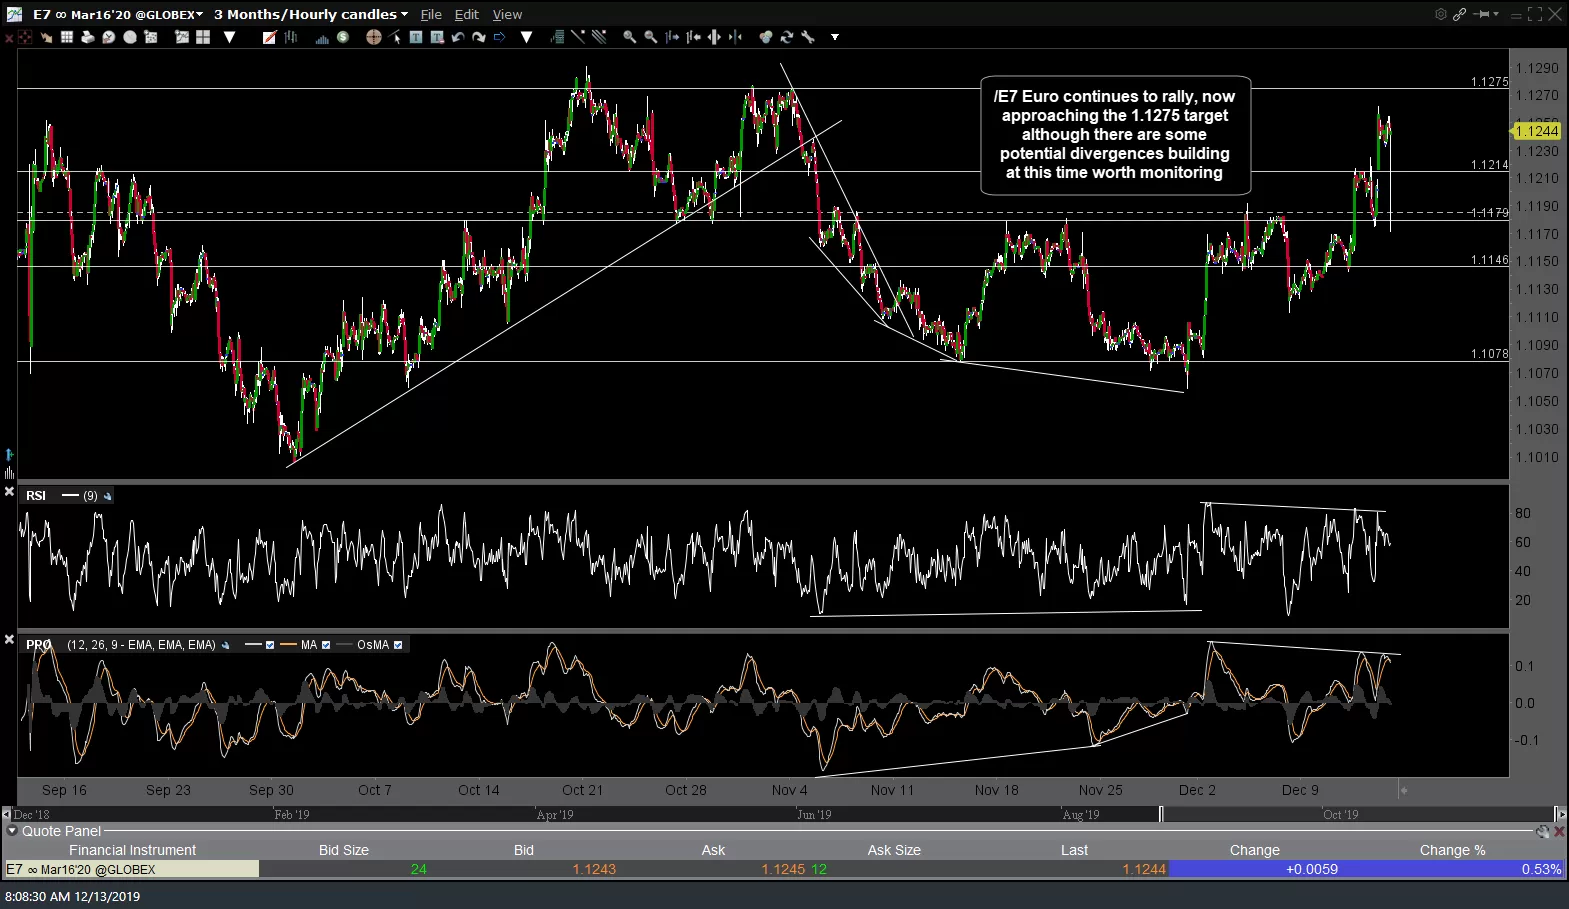
As a falling Dollar is net bullish for gold (net bullish as in all other things such as supply & demand being equal), the direction in which gold breaks from the recent trading range above will likely be impacted on the charts below. /E7 (Euro futures) continues to rally, now approaching the 1.1275 target although there are some potential divergences building at this time worth monitoring. The Euro is the largest component of the US Dollar Index, by far, so a rising Euro = a falling $USD & vice versa. Previous & updated 60-minute charts below.
-
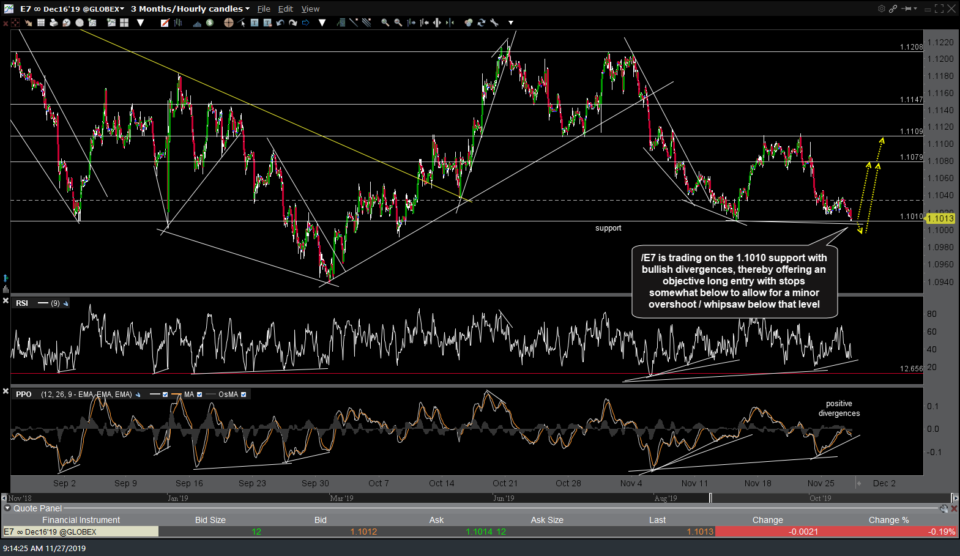
- E7 60m Nov 27th

-
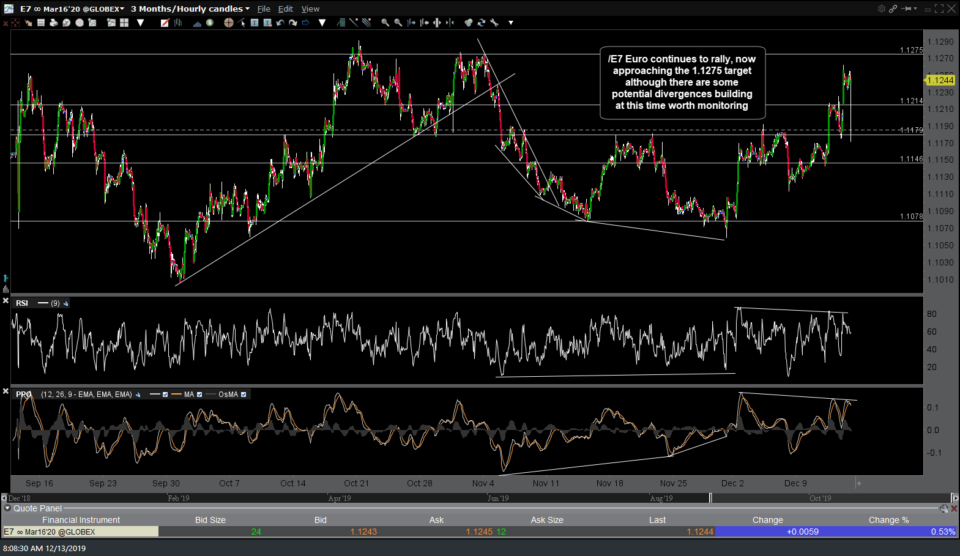
- E7 60m Dec 13th
On the daily time frame, EUR/USD (Euro/$US Dollar forex pair) is testing the 1.11819 R level with the next buy signal to come on a solid break above it. Bullish if it can do so soon & take out the potential divergences forming on the RSI & PPO although whether or not we get a pullback here first off resistance, the intermediate & longer-term outlook remains bullish. Previous & updated daily charts.
-
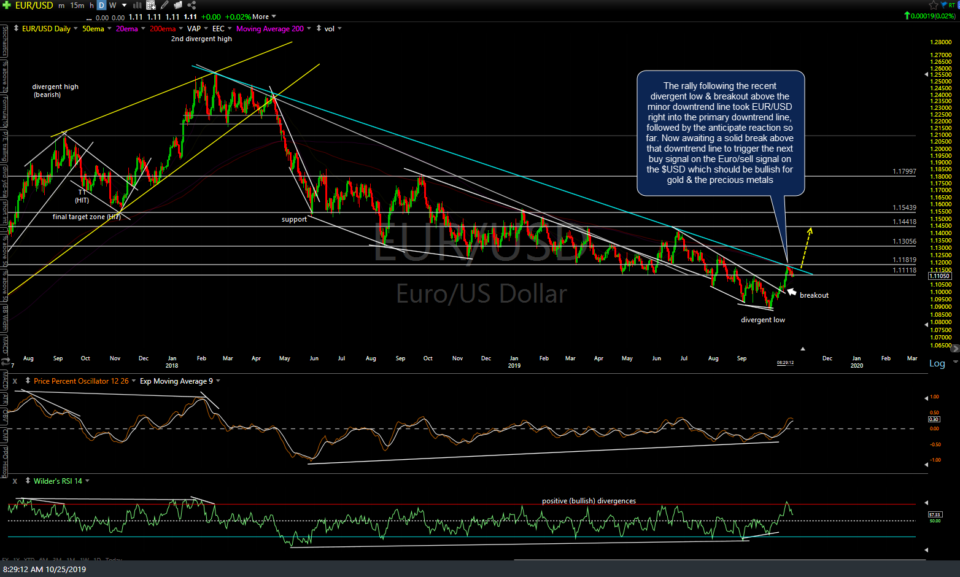
- EUR-USD daily Oct 24th close
-
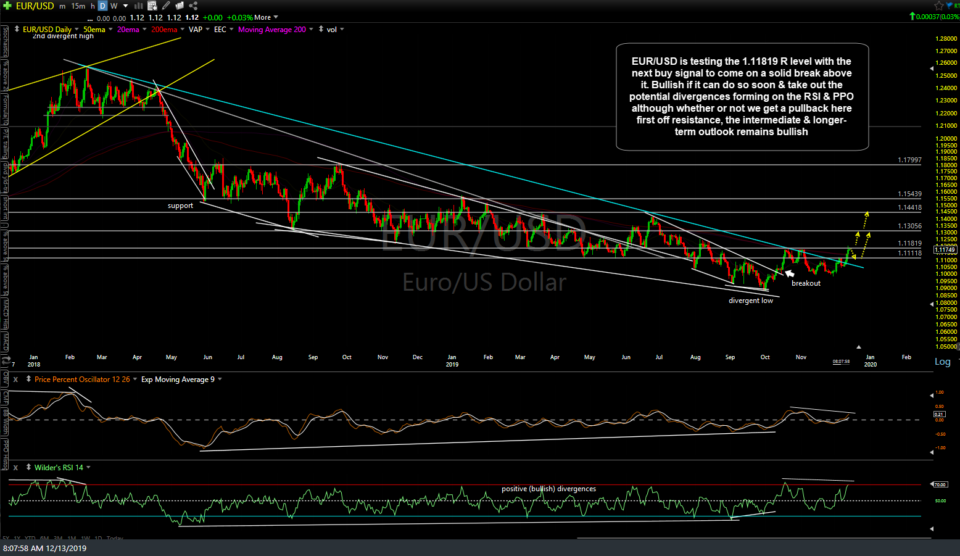
- EUR-USD daily Dec 13th
As mentioned in yesterday’s video, I will be away from my desk through at least late afternoon today & will reply to any questions or charts requests after I return.
Good trading!
-RP