
The two main ‘risk-off’ assets manage to close above key support levels today with the major stock indices closing flat after the usual big intraday price swings in the final 2-hours of trading that typically follow a FOMC rate decision. The trendline breakout in /GC gold futures earlier today proved to be a whipsaw (typical on a Fed rate day breakout) with gold going on to make another successful test of the 1492 support followed by a pop back up to the 1500 level.
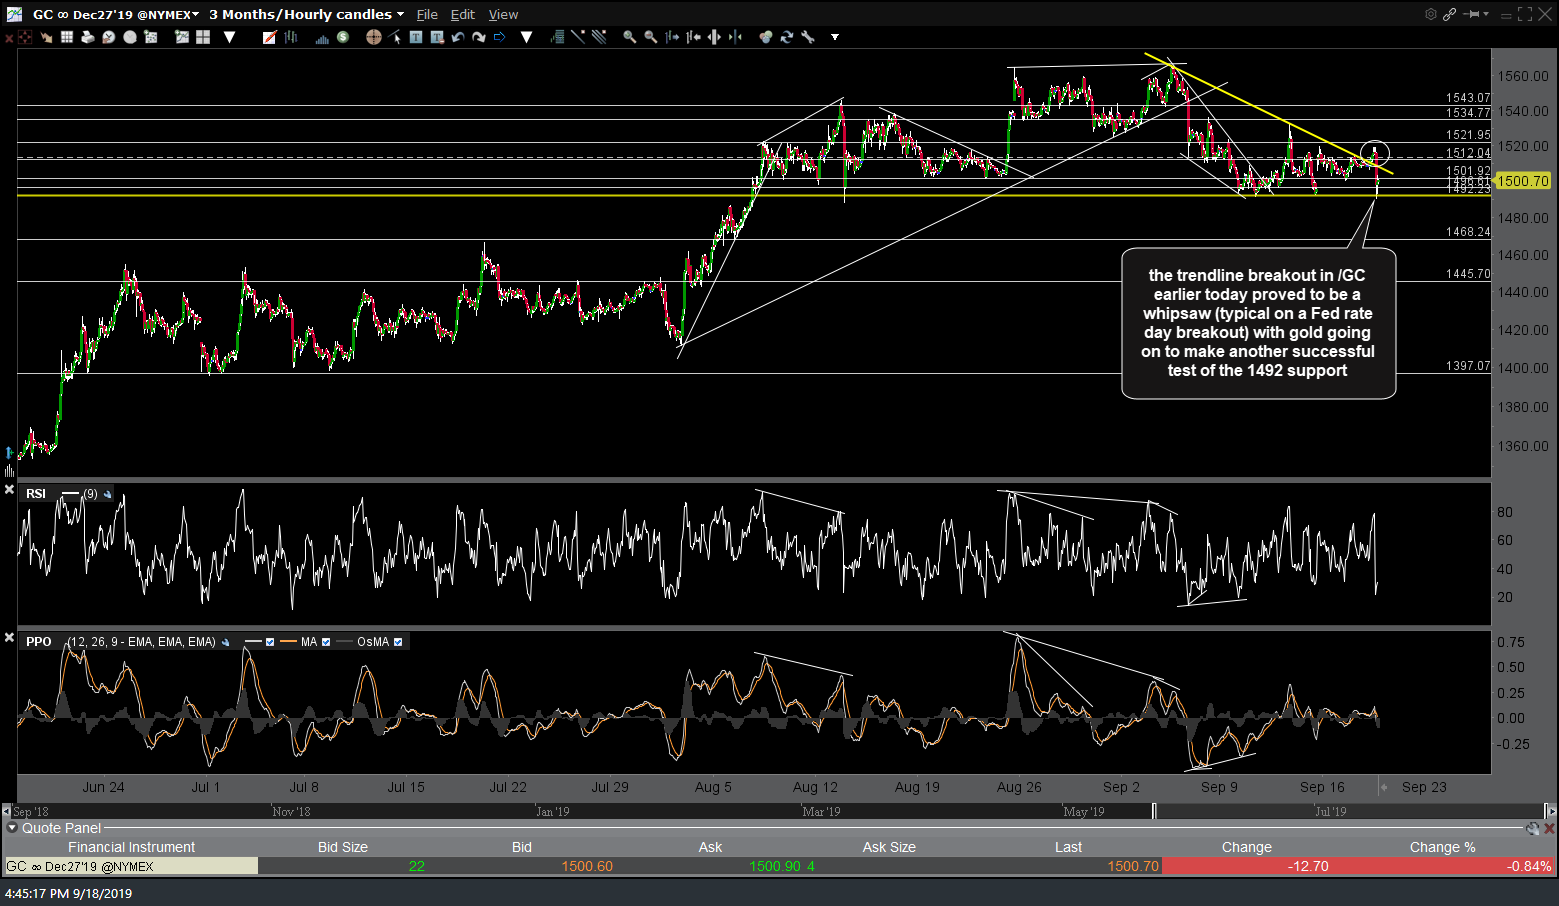
/GC gold futures 60m 2 Sept 18th
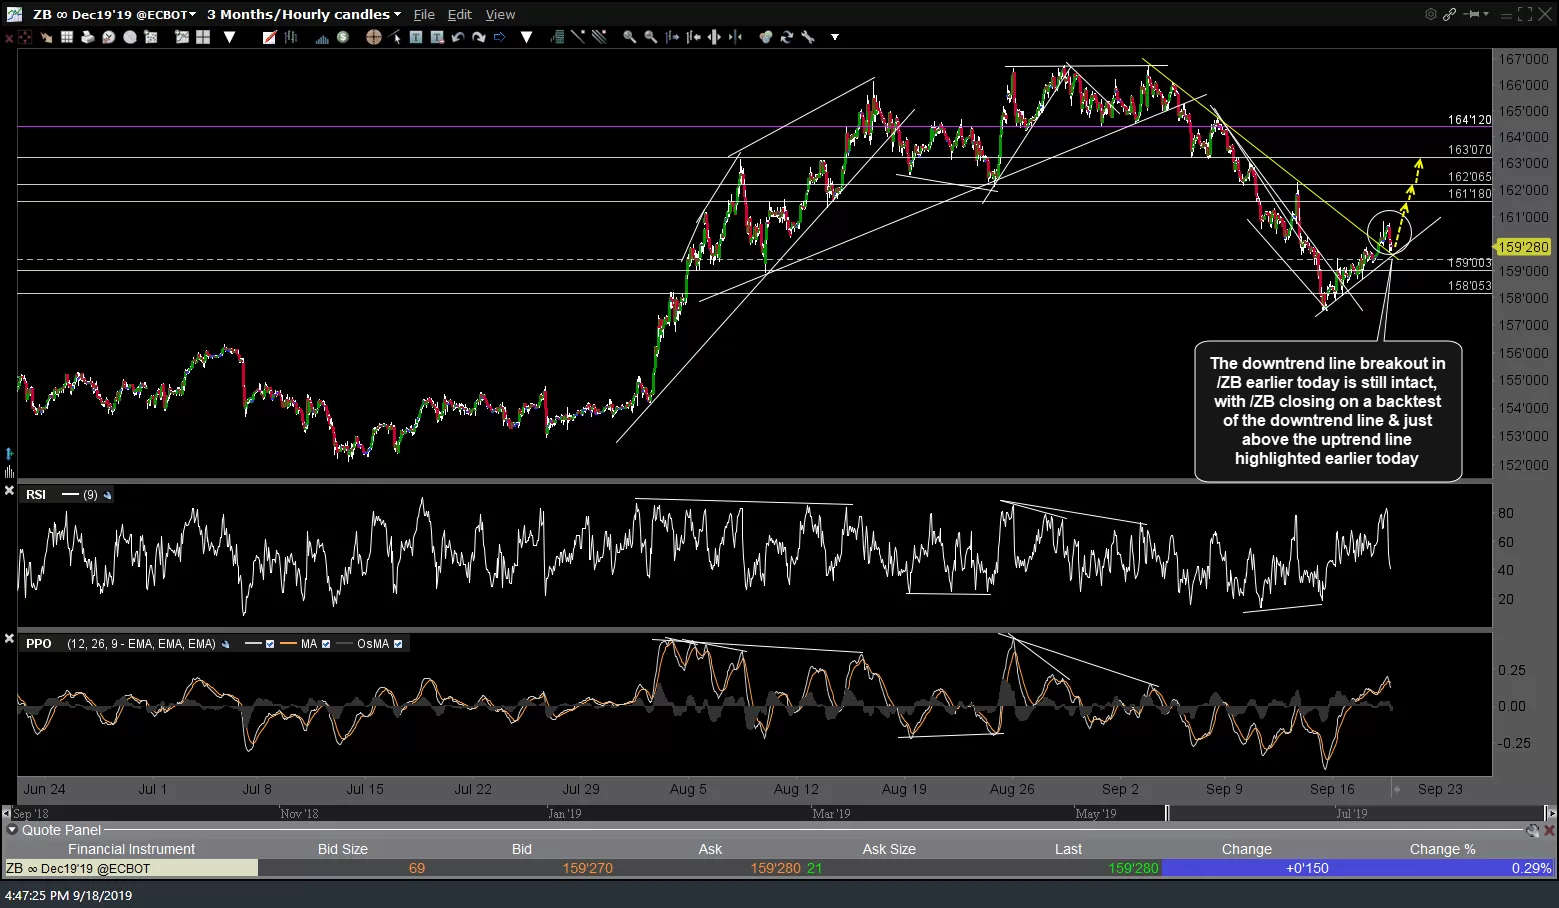
The downtrend line breakout in /ZB earlier today (shown on the first/previous chart below) is still intact, with /ZB closing on a backtest of the downtrend line & just above the uptrend line highlighted earlier today. Whether or not gold & Treasuries hold & rally off these support levels or break below them, followed by a wave of selling is likely to depend on whether the stock market breaks out to new highs & well-beyond soon or start moving lower from at or around (+2-3%) current levels as appears most likely at this time. Either way, long positions in gold (GLD) and/or Treasuries (TLT) can be used as an indirect hedge against a short position on the equity indices or as part of a diversified portfolio using asset allocation.
-

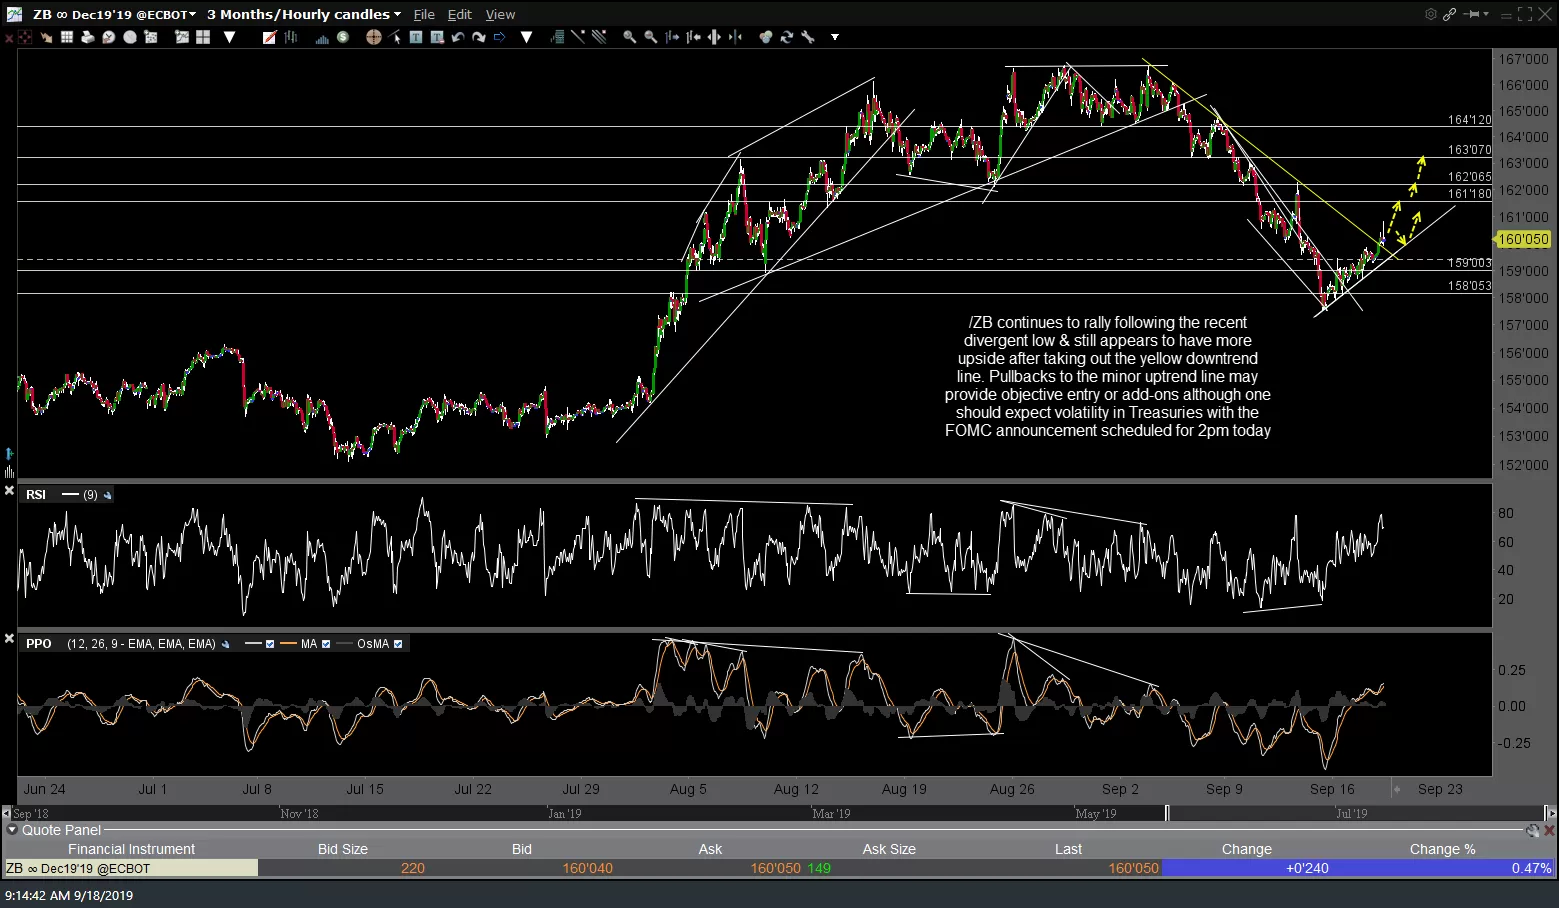
- ZB 60m Sept 18th
-

- /ZB 30-yr T-Bond Futures 60m 2 Sept 18th
While TLT & /ZB remain above support & will likely continue to rally should the stock market reverse soon, a break below this potential bear flag & especially the 136.54 support would be bearish & likely take TLT back down to the 133.22 + uptrend line support. As such, stops are not an option if long TLT or /ZB as either a pure-play long trade or a hedge to equity shorts.
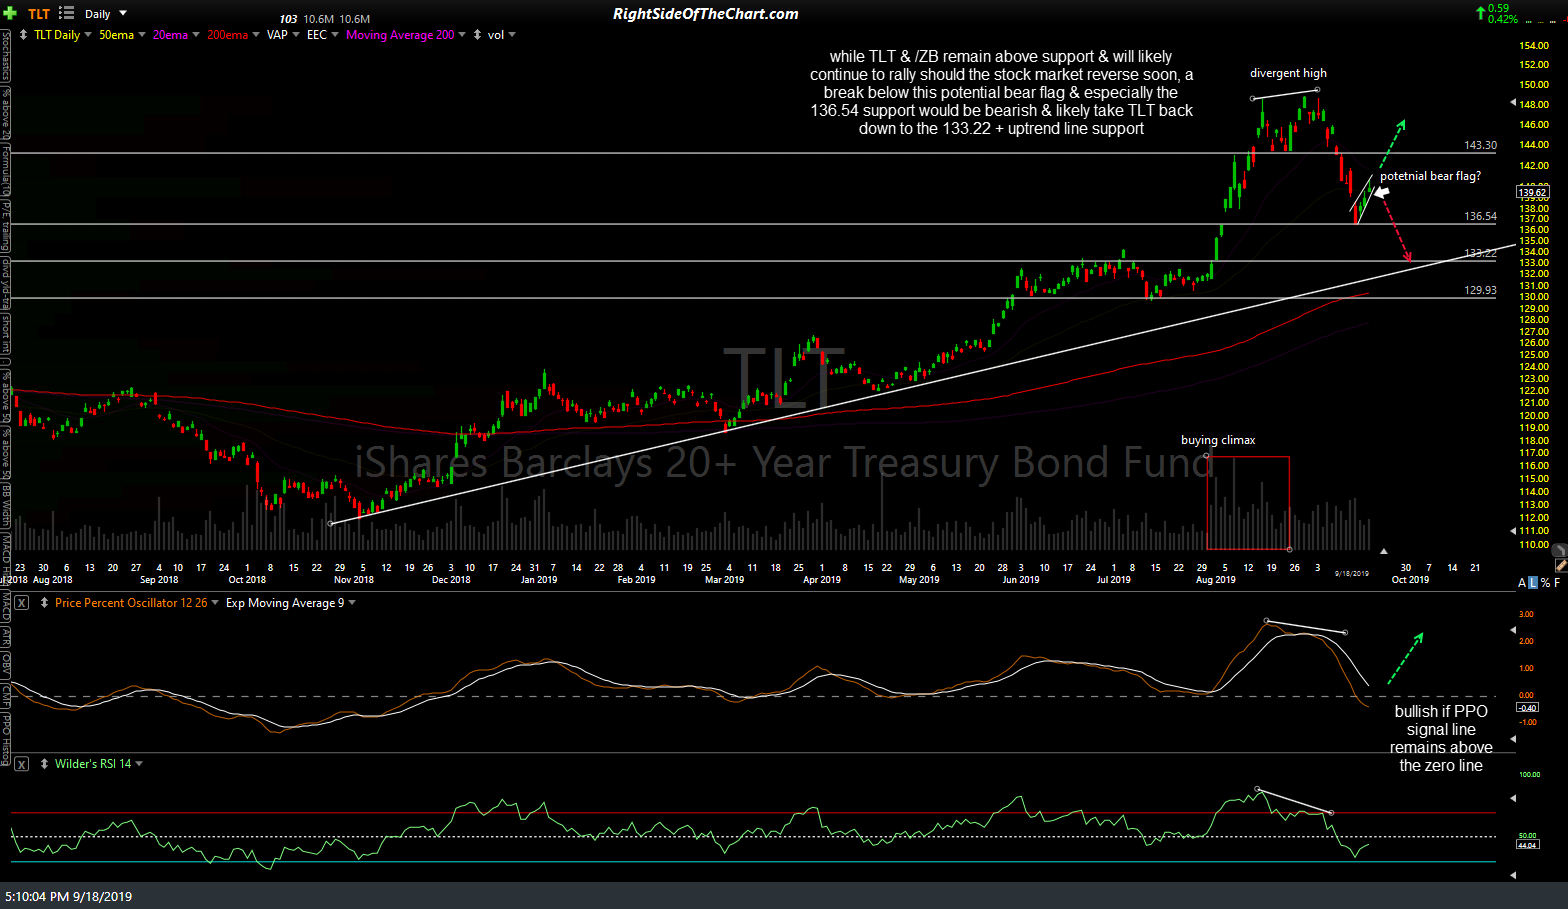
TLT daily Sept 18th