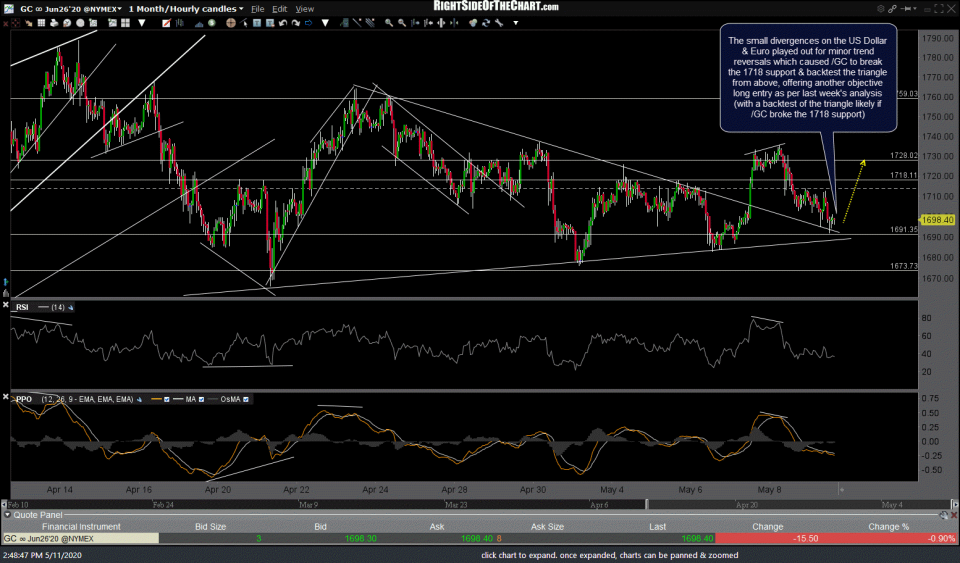
The small divergences on the US Dollar & Euro played out for minor trend reversals which caused /GC (gold futures) to break the 1718 support & backtest the triangle from above, offering another objective long entry as per last week’s analysis. Previous (Friday’s) and today’s updated 60-minute charts below.
multiple charts in a gallery format, such as some of the charts in this post, will not show on the email notifications but may be viewed on rsotc.com
- GC 60m 2 May 8th
- GC 60m May 11th
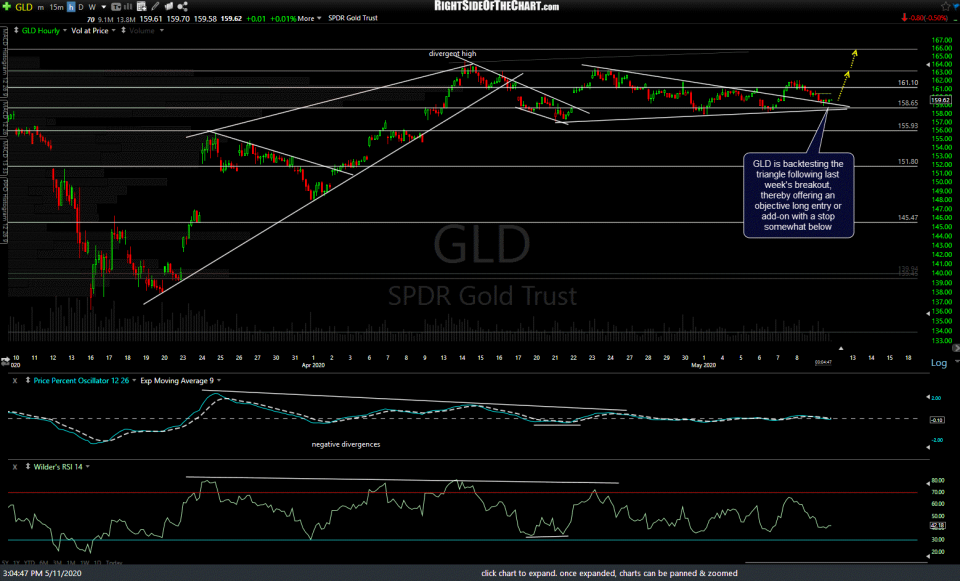
Likewise, GLD (gold ETF) is backtesting the triangle following last week’s breakout, thereby offering an objective long entry or add-on with a stop somewhat below.
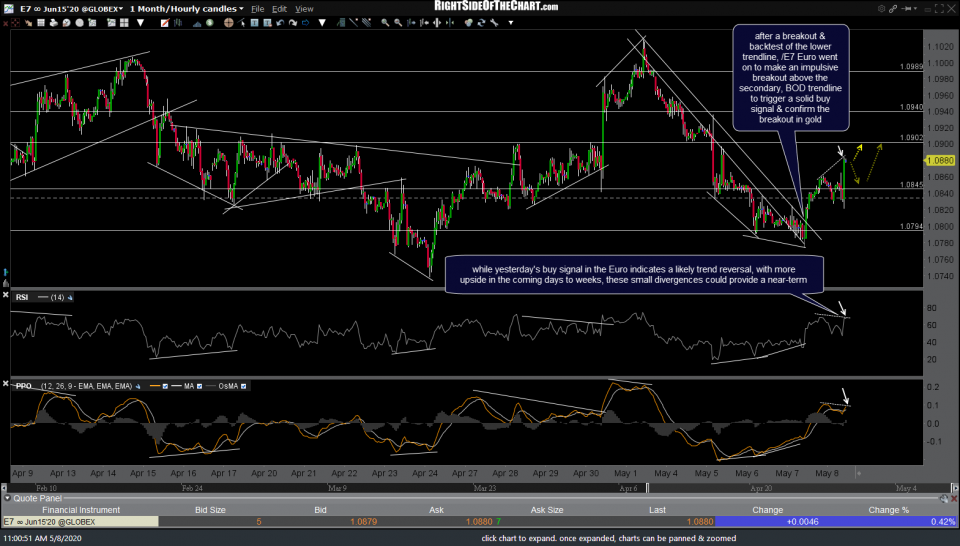
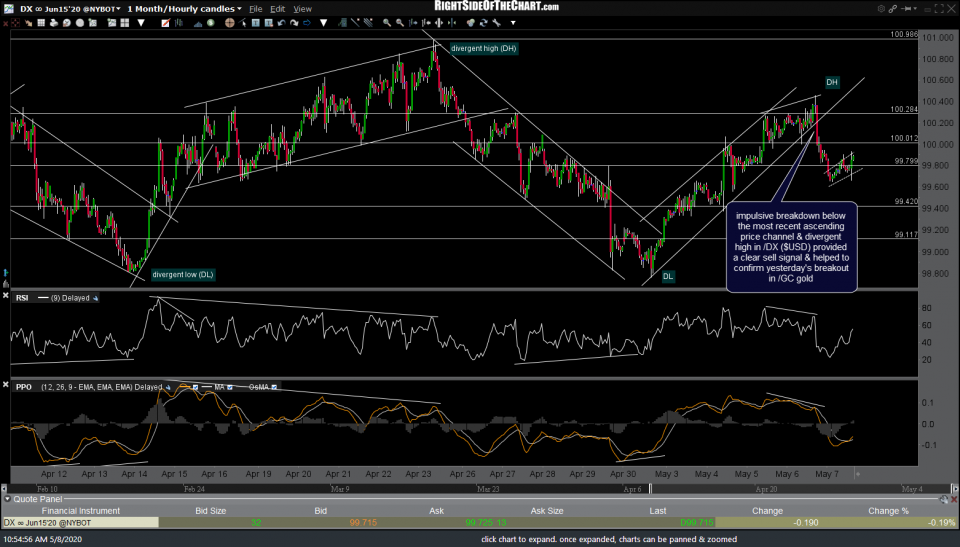
Those small divergences that formed following last week’s breakout in /E7 (Euro futures) ended up playing out for a near-term pullback that has taken the Euro back to the breakout level. Ditto for /DX ($US Dollar futures) but in reverse, as the Dollar & Euro move inversely. Friday’s & today’s updated 60-minute charts below.
- E7 60m May 8th
- E7 60m May 11th
- DX 60m May 8th
- DX 60m May 11th


