
/GC gold testing the 1951 resistance while after the most recent bounce off the uptrend line while /DX ($USD) is testing downtrend line resistance. Red scenario most like if /DX makes a solid breakout, green scenario likely if /DX is rejected followed by another leg down. All charts below are 60-minute time frames.
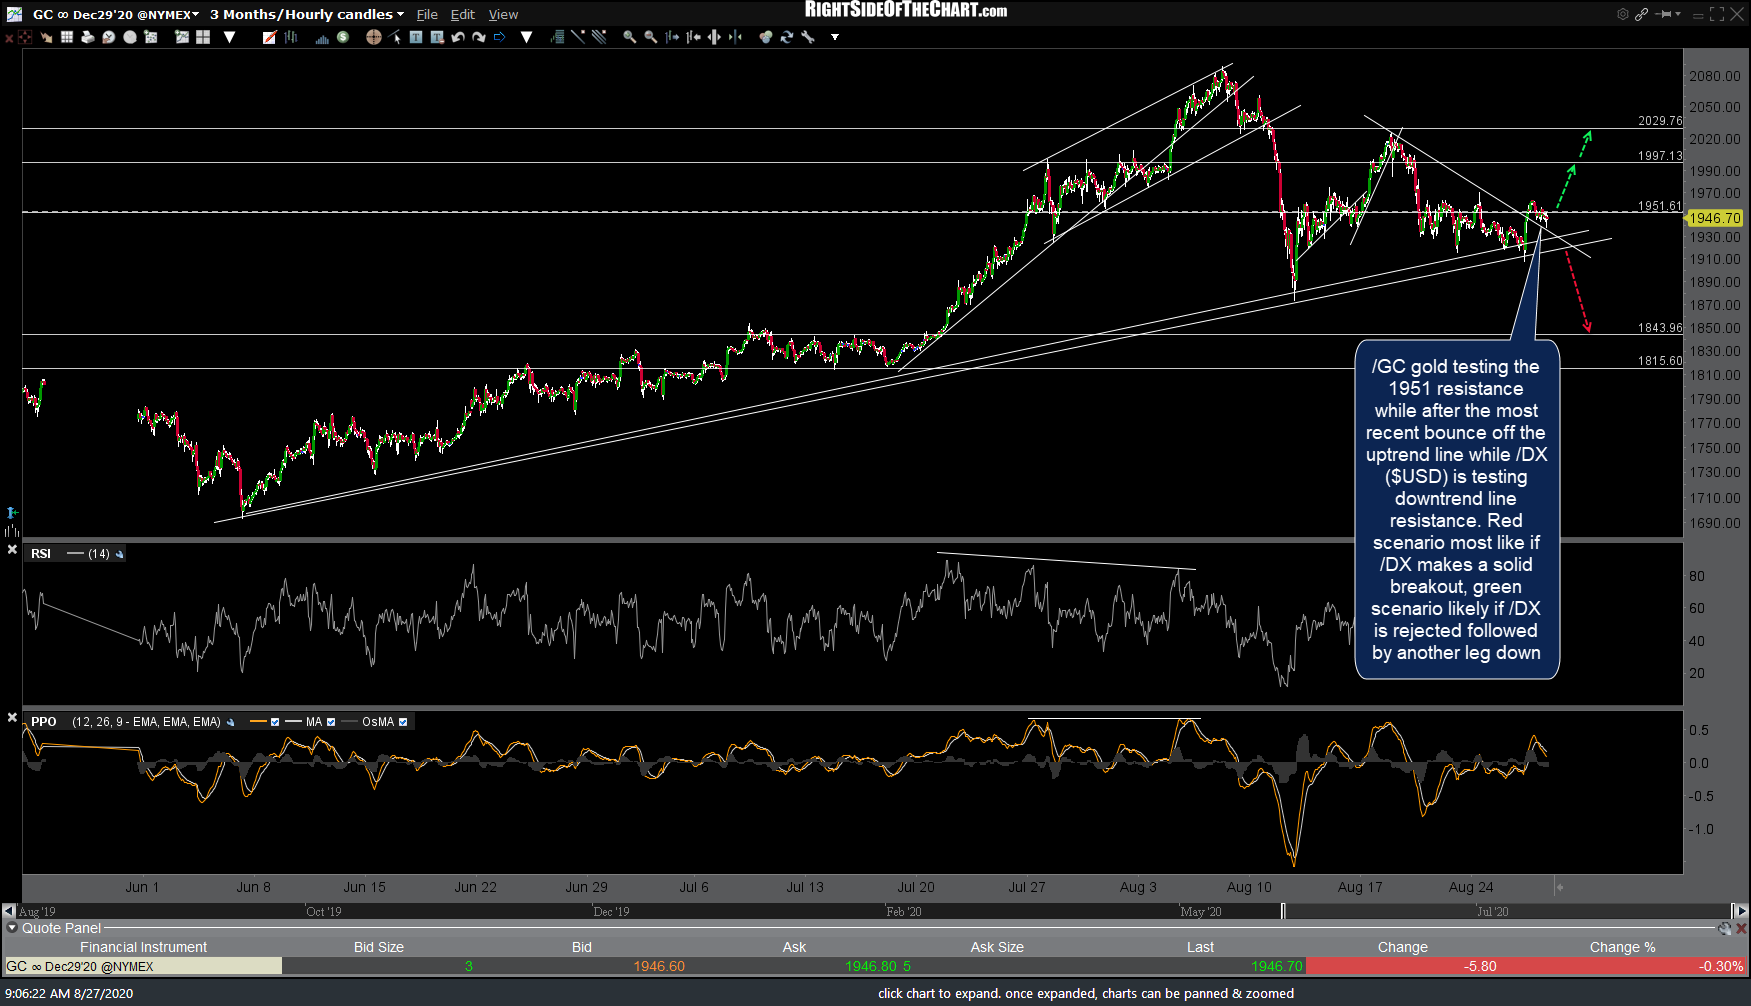
GC 60m Aug 27th
/SI silver is trading at the intersecting downtrend line + 27.37 price resistance while /DX ($USD) is once again testing the 60-minute downtrend line. Red scenario most likely if /DX makes a solid breakout above the downtrend line, green scenario on a rejection off that trendline.
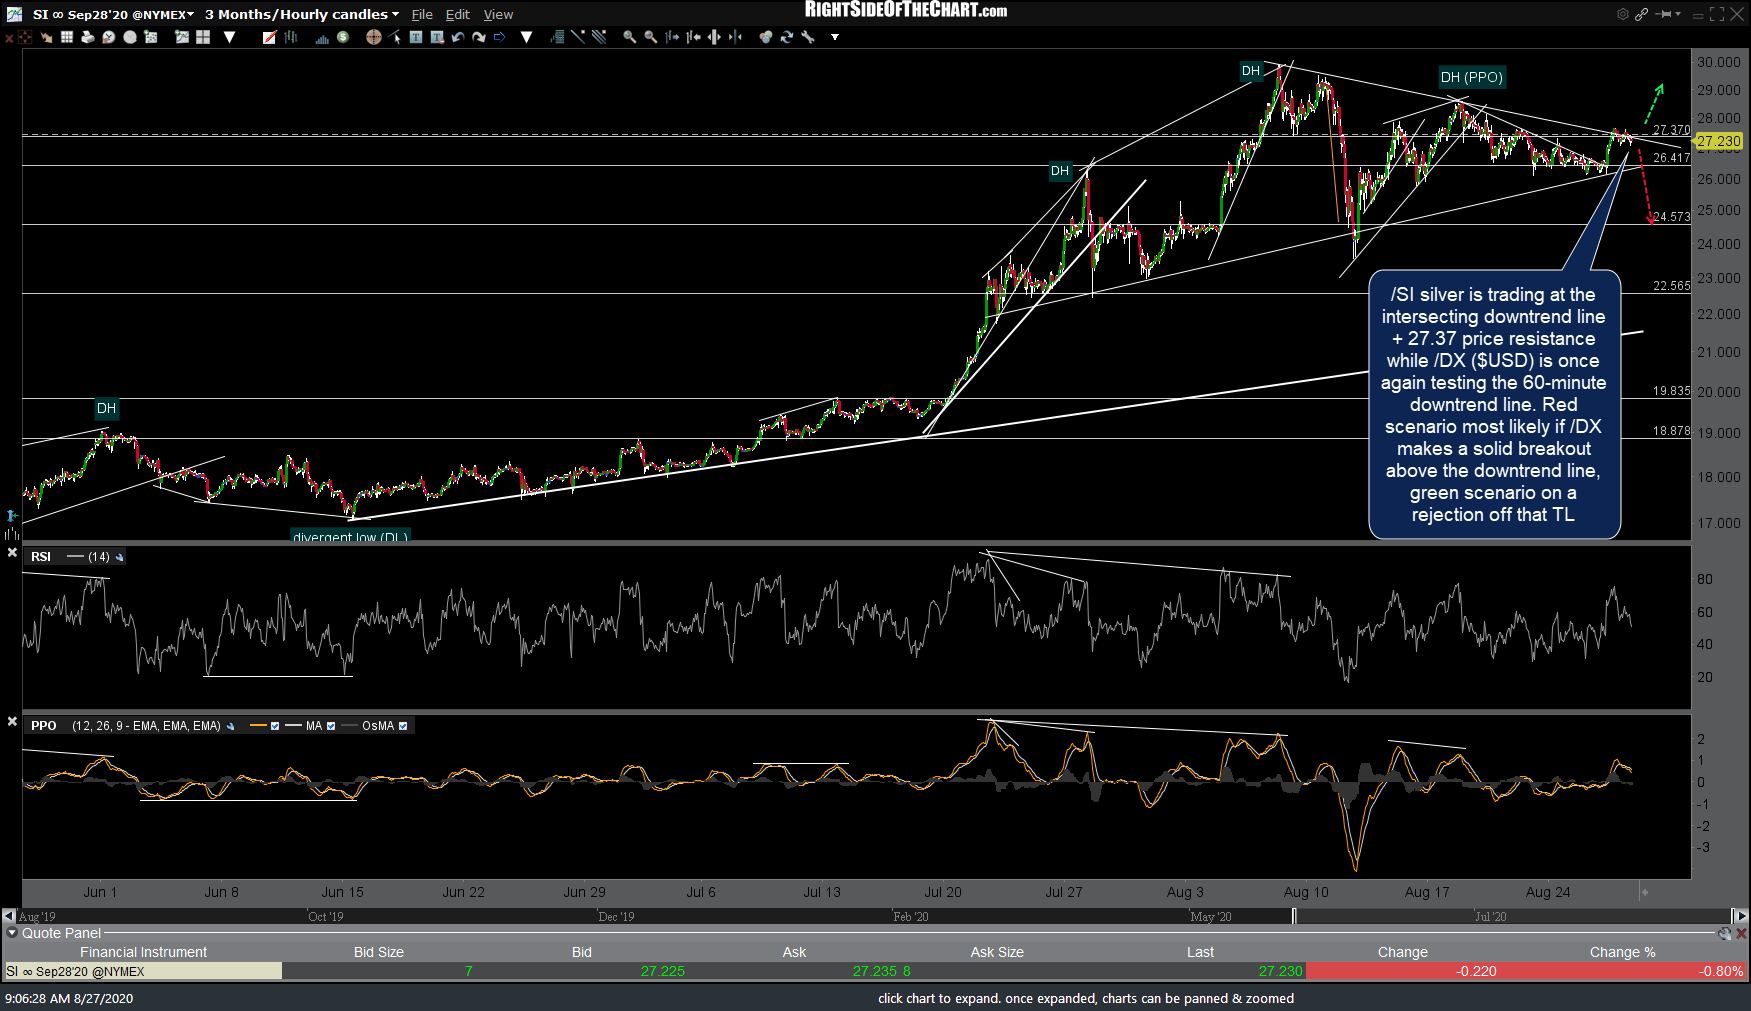
SI 60m Aug 27th
/DX ($USD) continues to test the primary downtrend line on this 60-min chart with a solid break above likely to spark a rally up to at least the 93.95ish level or a rejection here opening the potential for another marginal new, yet still divergent low.
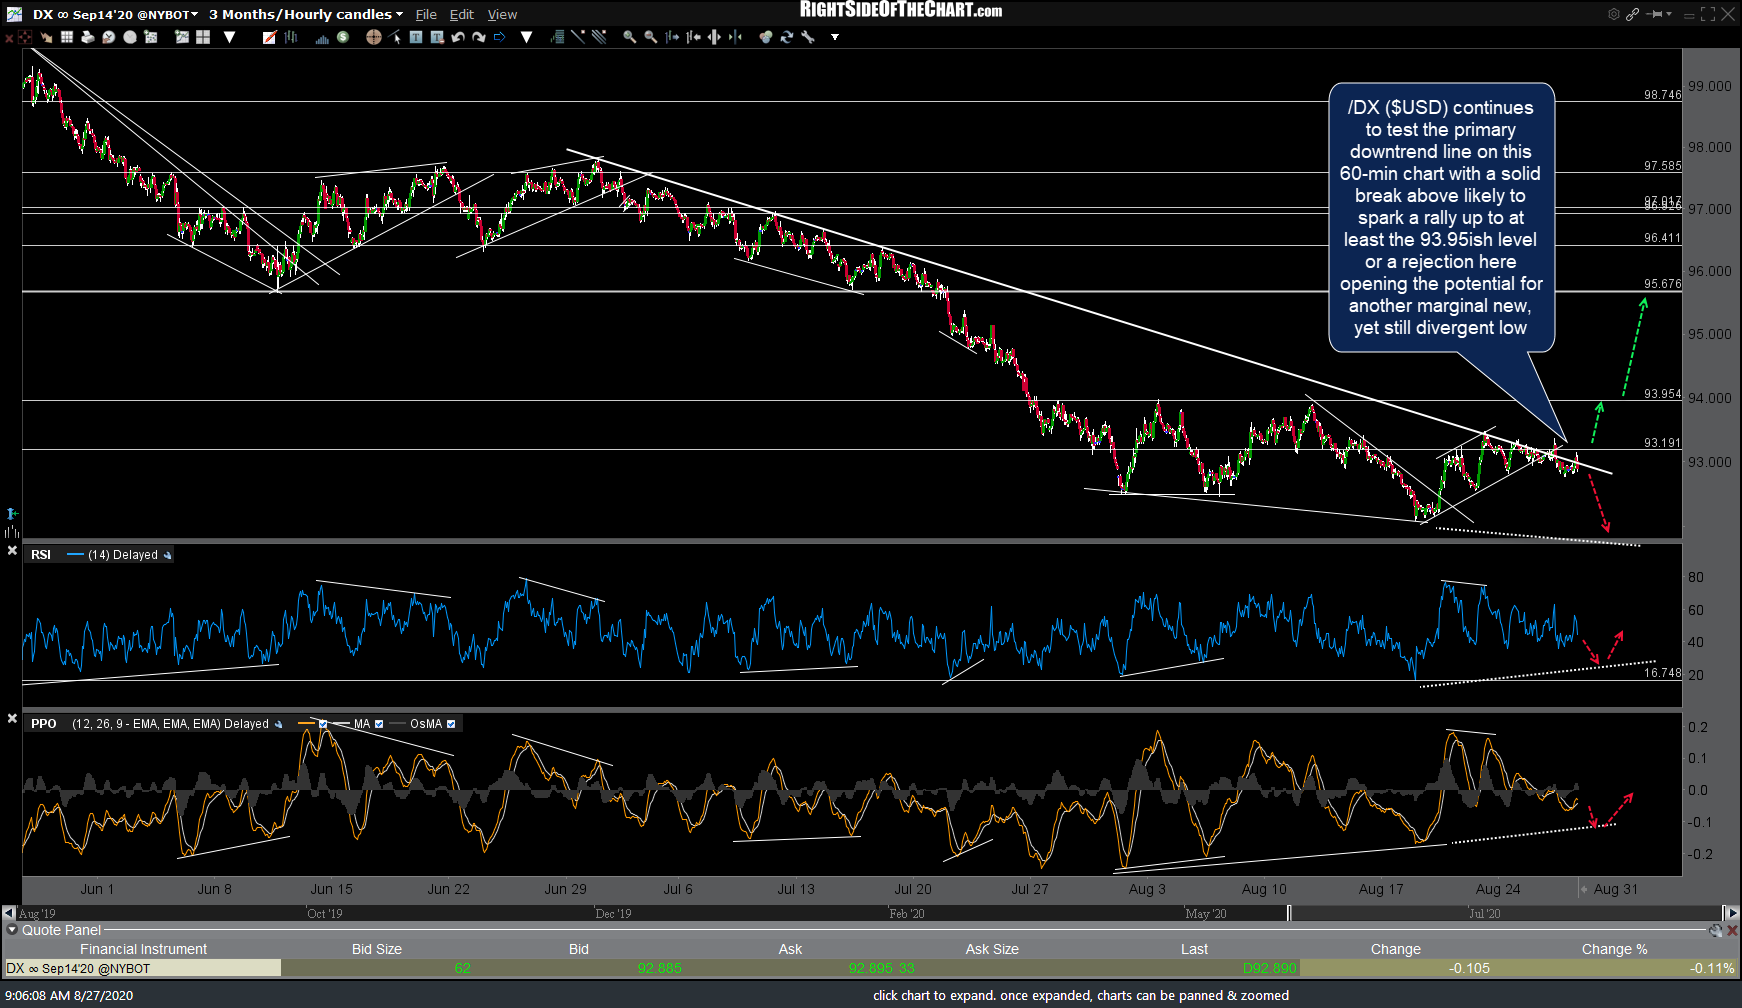
DX 60m Aug 27th
FWIW, I don’t have a strong preference for either of these near-term scenarios as I’d put about 50/50 odds on each one. As such, my preference is to sit back today & wait to see how these levels are resolved.