
Today will end the 6th consecutive week that GLD (gold ETF) has traded around the key 186ish long-term resistance level (previous bull market top). Both charts below are long-term weekly charts with the chart posted back on August 6th followed by today’s updated chart.
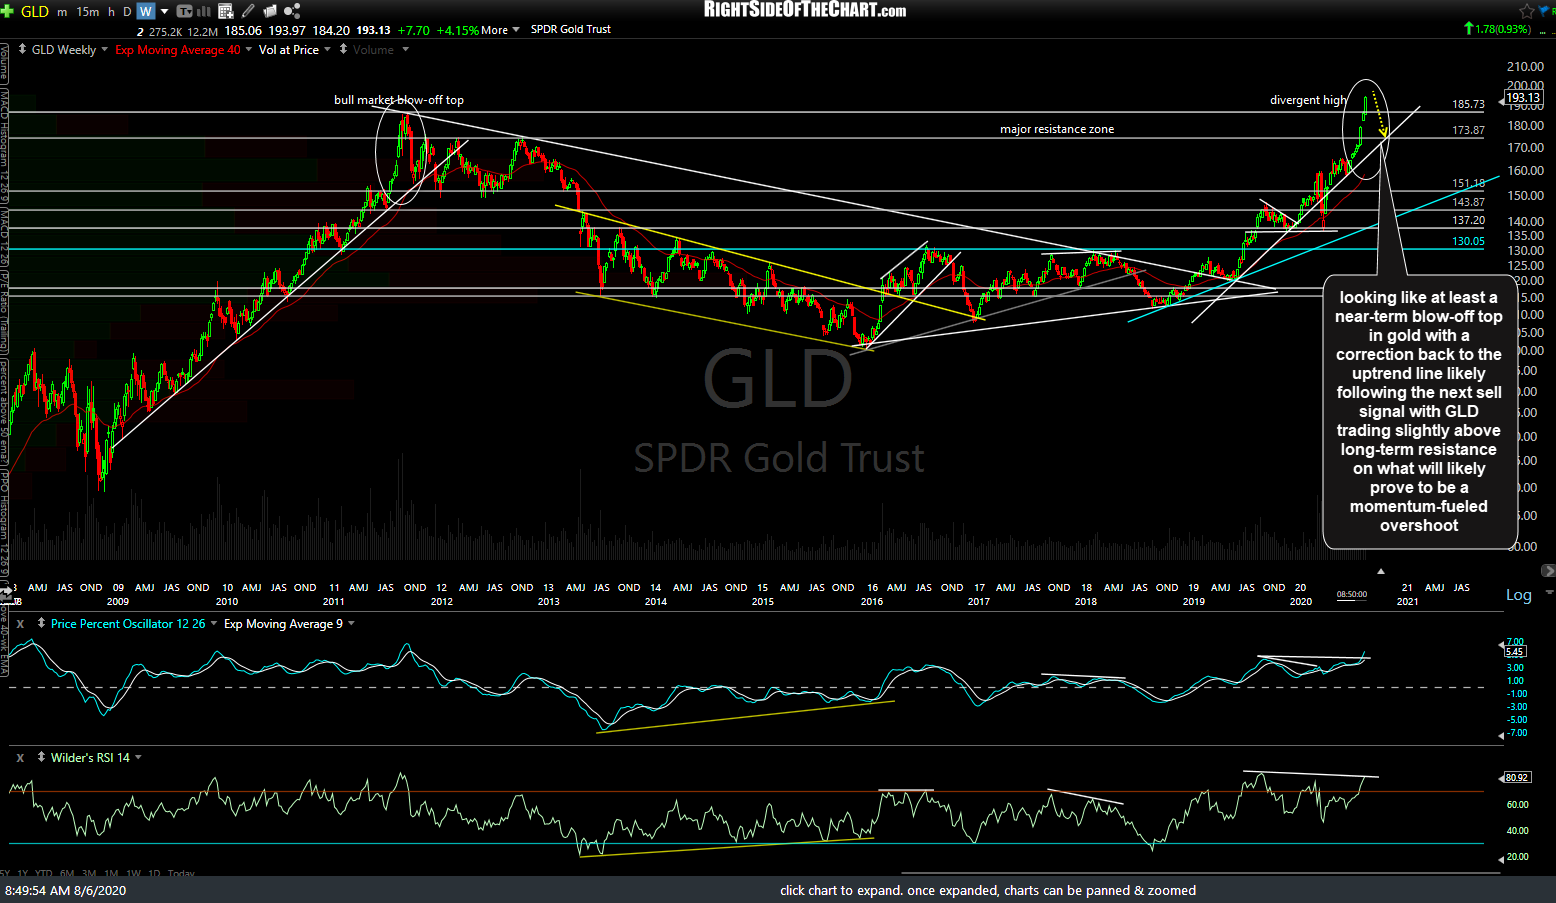
GLD weekly Aug 6th
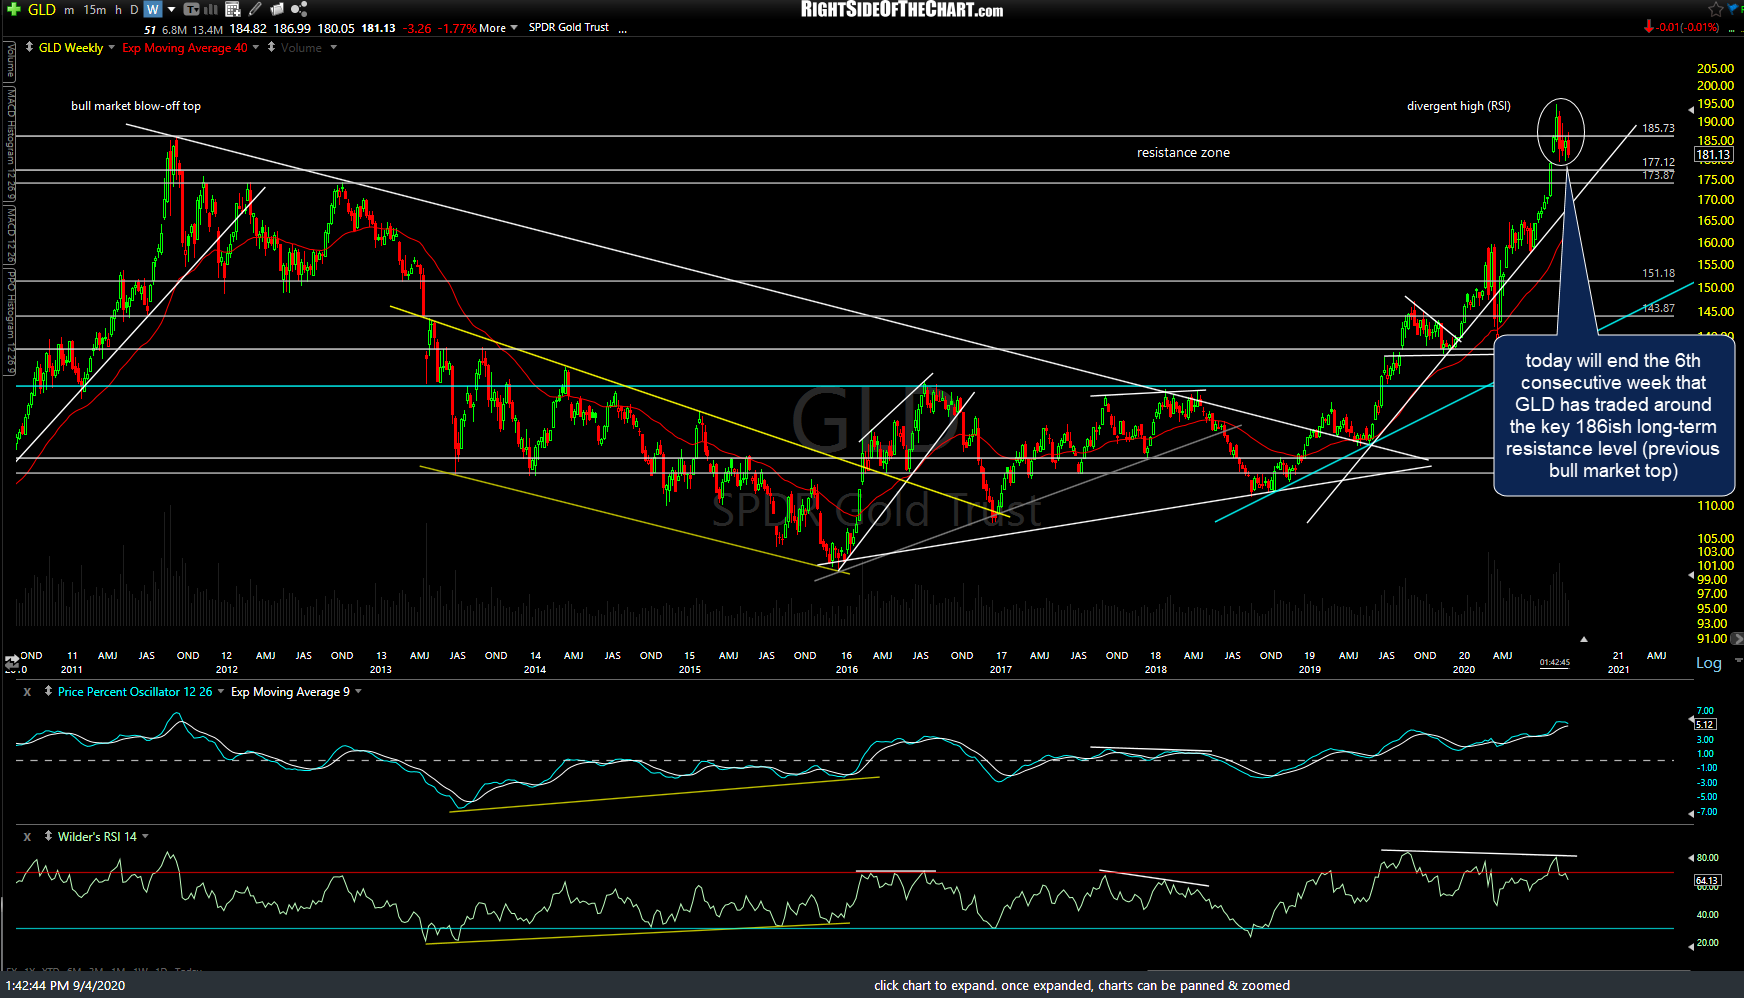
GLD weekly Sept 4th
Zooming down to the 60-minute time frames, /GC is wedged between the 60-minute uptrend line & minor downtrend line support with a solid break above or below either likely to determine the next near-term direction in gold (although /GC also needs to clear the 1952ish resistance level just above the minor downtrend line to open the door for more upside).
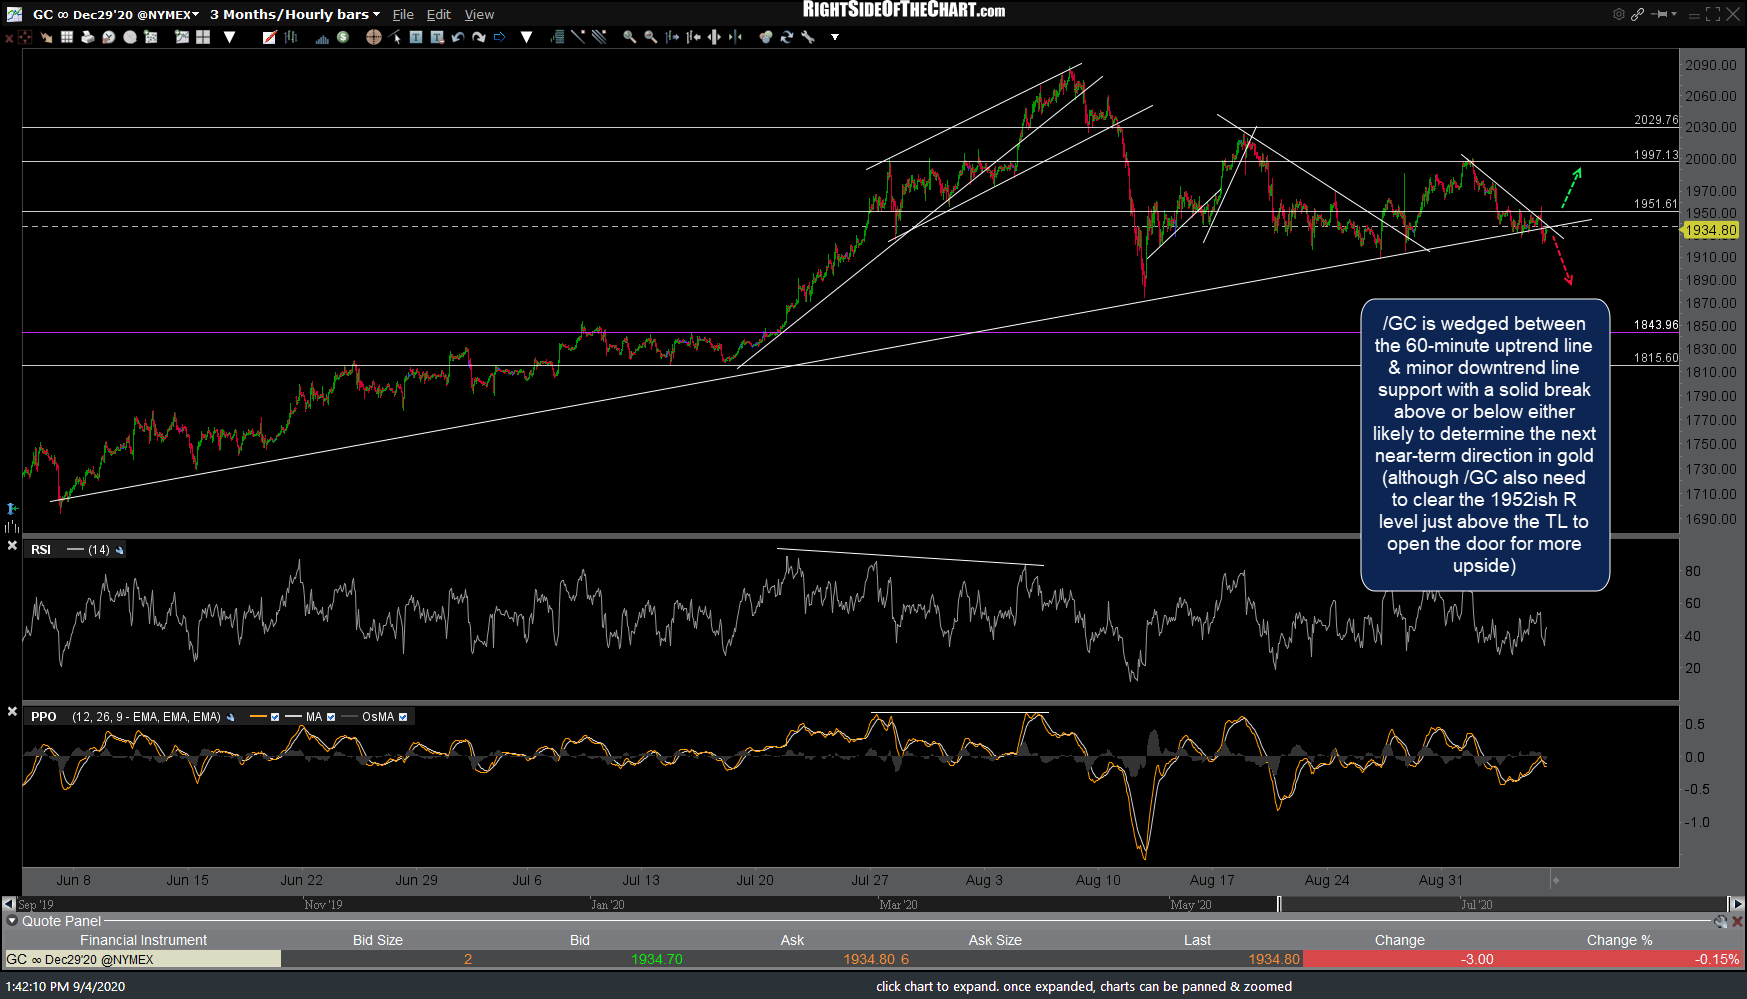
GC 60m Sept 4th
Likewise, /SI is pinched between the 26.220 support & minor downtrend line resistance with a solid break below or above either likely to determine the next near-term trend in silver.
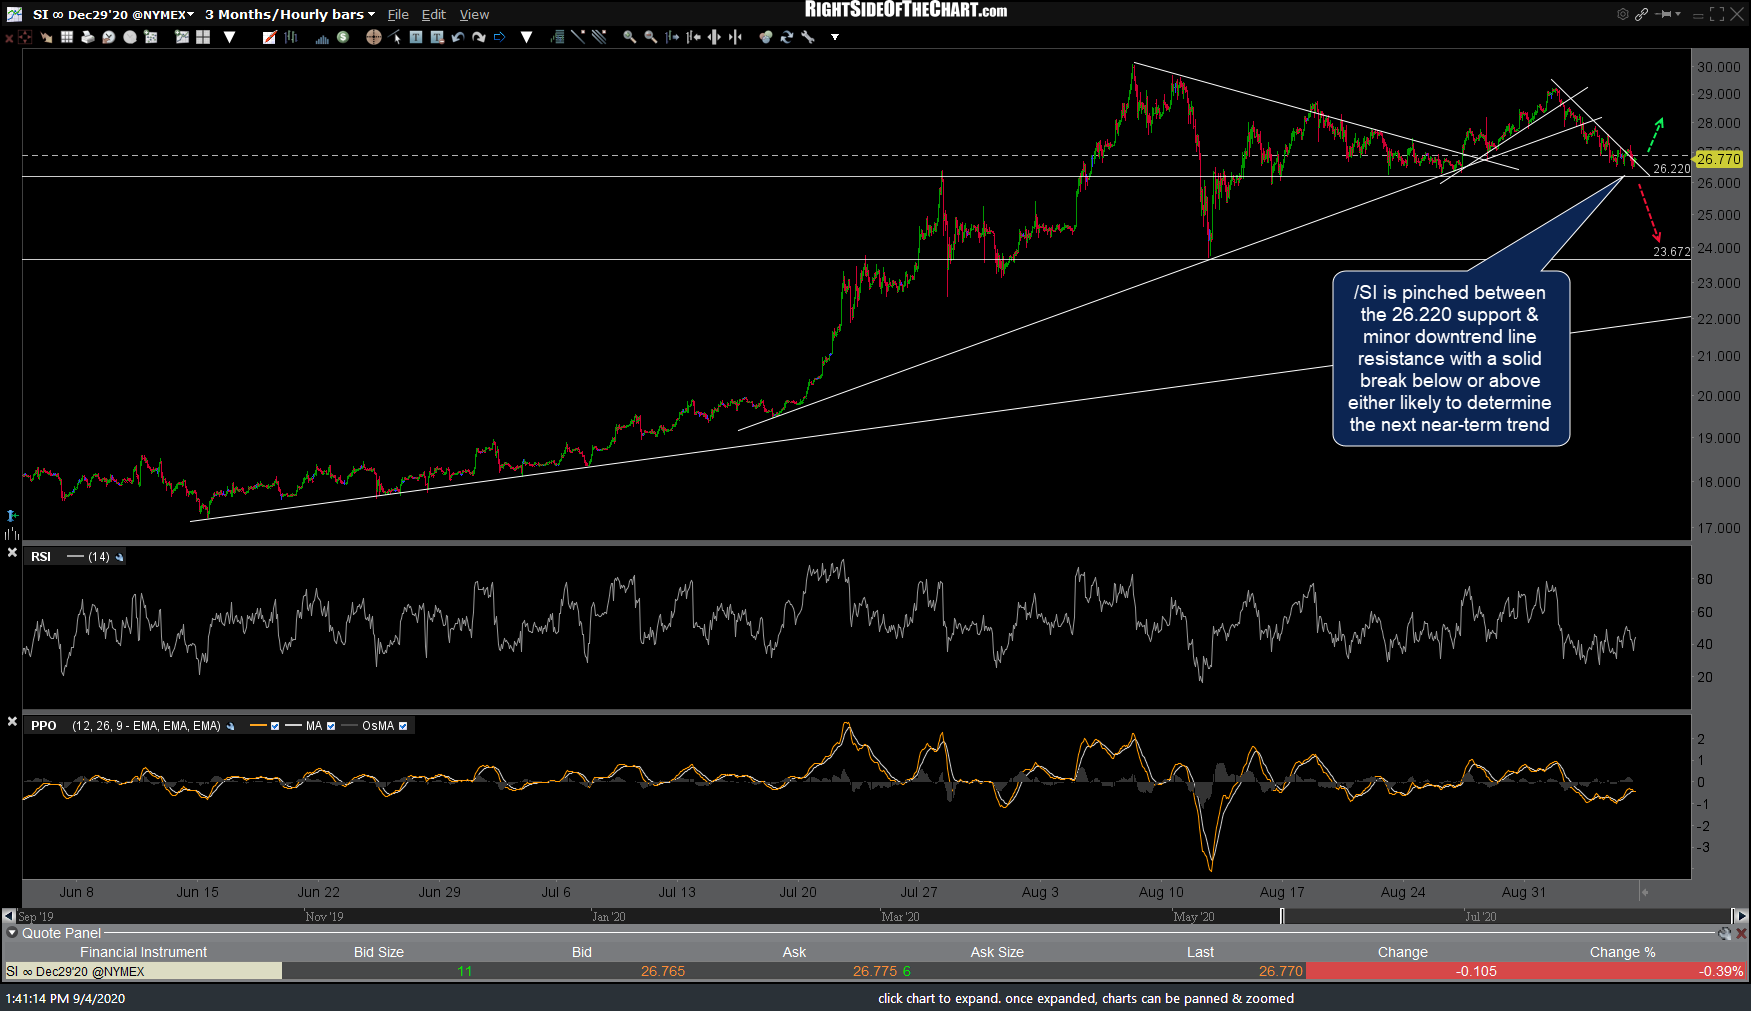
SI 60m Sept 4th
As gold typically trades inversely to the US Dollar, I continue to monitor the charts of /DX (US Dollar futures) closely. Following the recent divergent low followed by the breakout above the 60-minute bullish falling wedge pattern, /DX rallied into & was just rejected off the intersecting minor downtrend line + 93.191ish price resistance level with the next buy signal to come on a solid break and/or 60-minute close above it. Previous (Sept 1st) & updated 60-minute charts of /DX below.

DX 60m Sept 1st
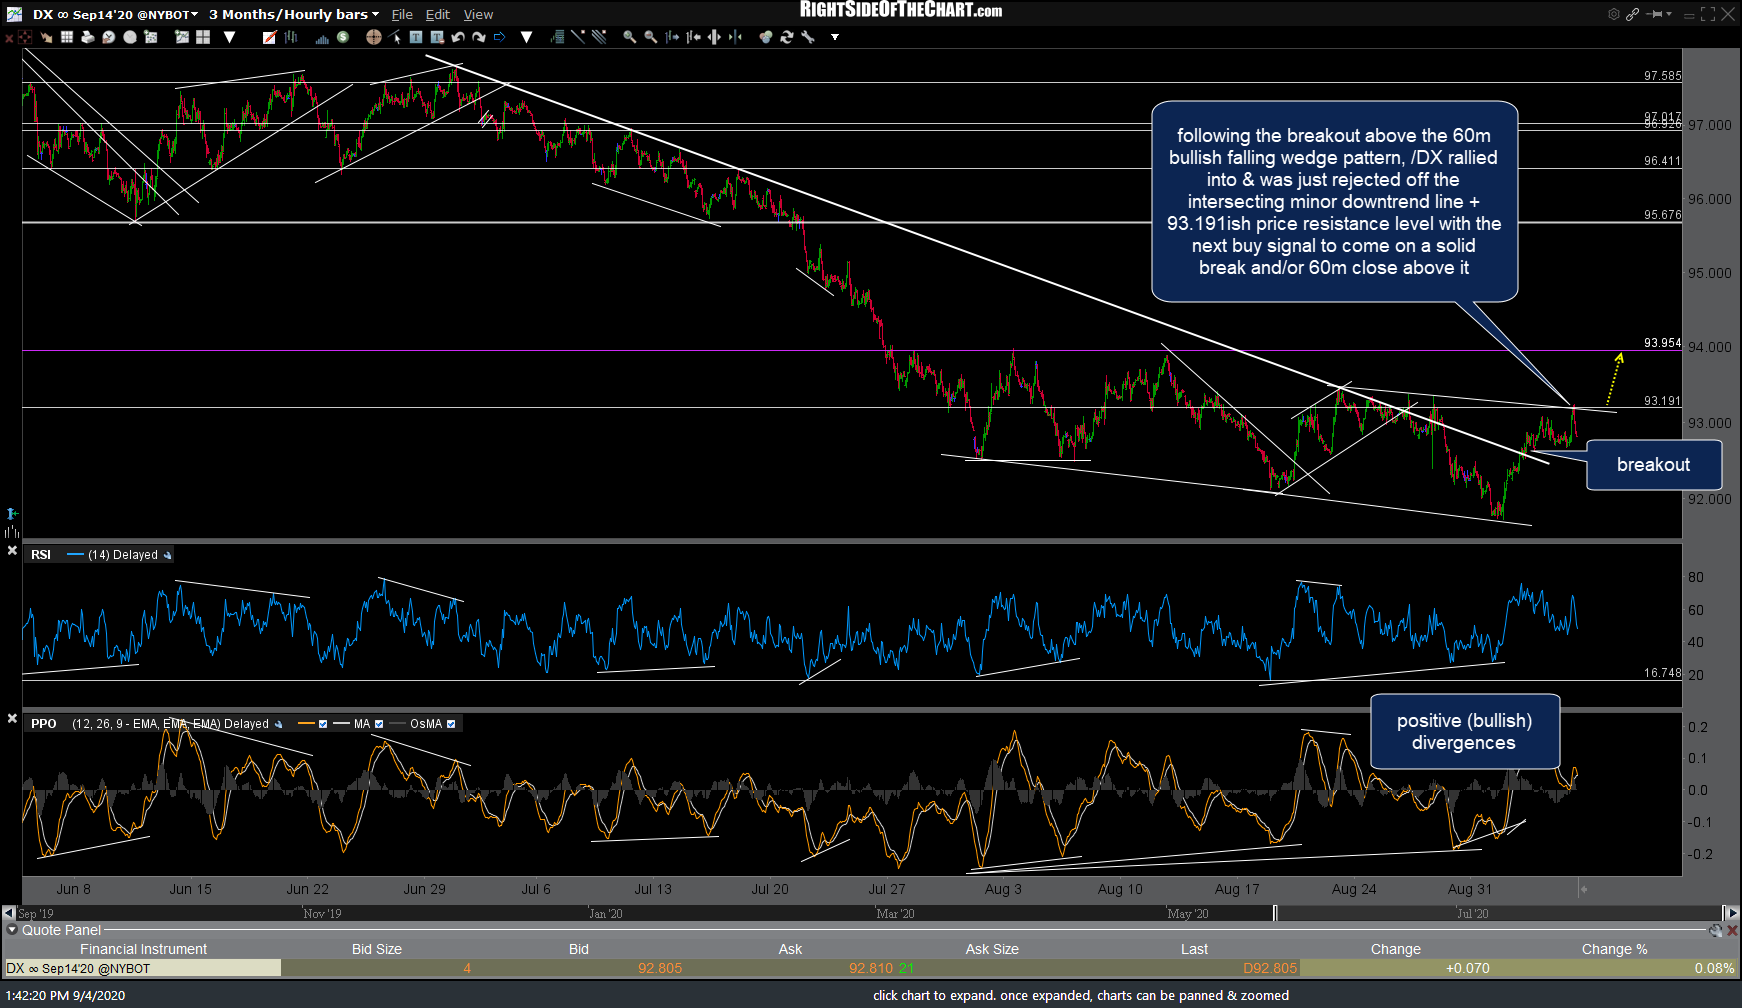
DX 60m Sept 4th