
Here’s a quick look at the ‘risk-off’ assets; gold & US Treasury bonds, which tend to rally during stock market corrections & quite often (but not always) fall when the market is rallying. I’ve included silver as well since it tends to ebb & flow with gold.
GLD (gold ETF) has just put in a divergent high on the 60-minute chart & looks susceptible to a pullback as soon as the market bounces & possibly before then.

GLD 60m March 6th
/GC gold futures have rallied into the 1692 resistance level with negative divergences in place on the indicators. A break below this uptrend line could spark a correction back to at least the 1654 support level although as a flight-to-safety asset, gold will likely remain in rally mode as long as the stock market is correcting although sometimes gold (and/or Treasuries) will start to turn down shortly before the stock market bottoms, providing a “tell” of a potential impending end or at least temporary end to the selling in the stock market.
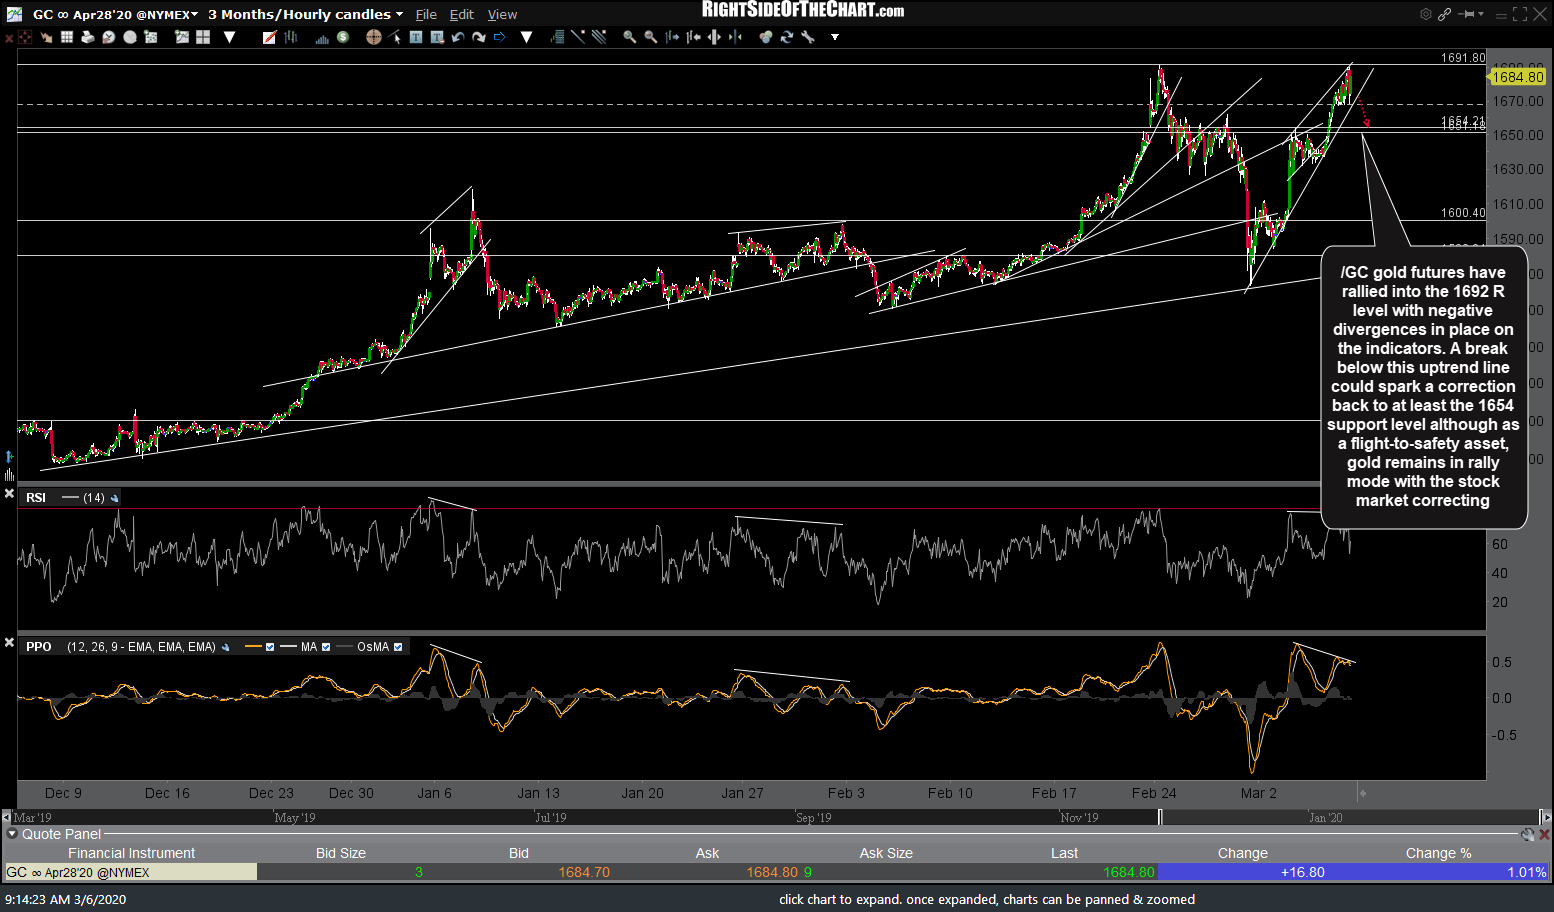
GC 60m March 6th
/SI (silver futures) rallied into the 17.500 resistance level followed by a spike (breakdown) below this rising wedge pattern. While a solid break above 17.500 is possible & would be near-term bullish, this is a significant resistance level & the recent wedge breakdown has already taken /SI to the first support of 17.250 & could also bring it down to the next support at 17.051.
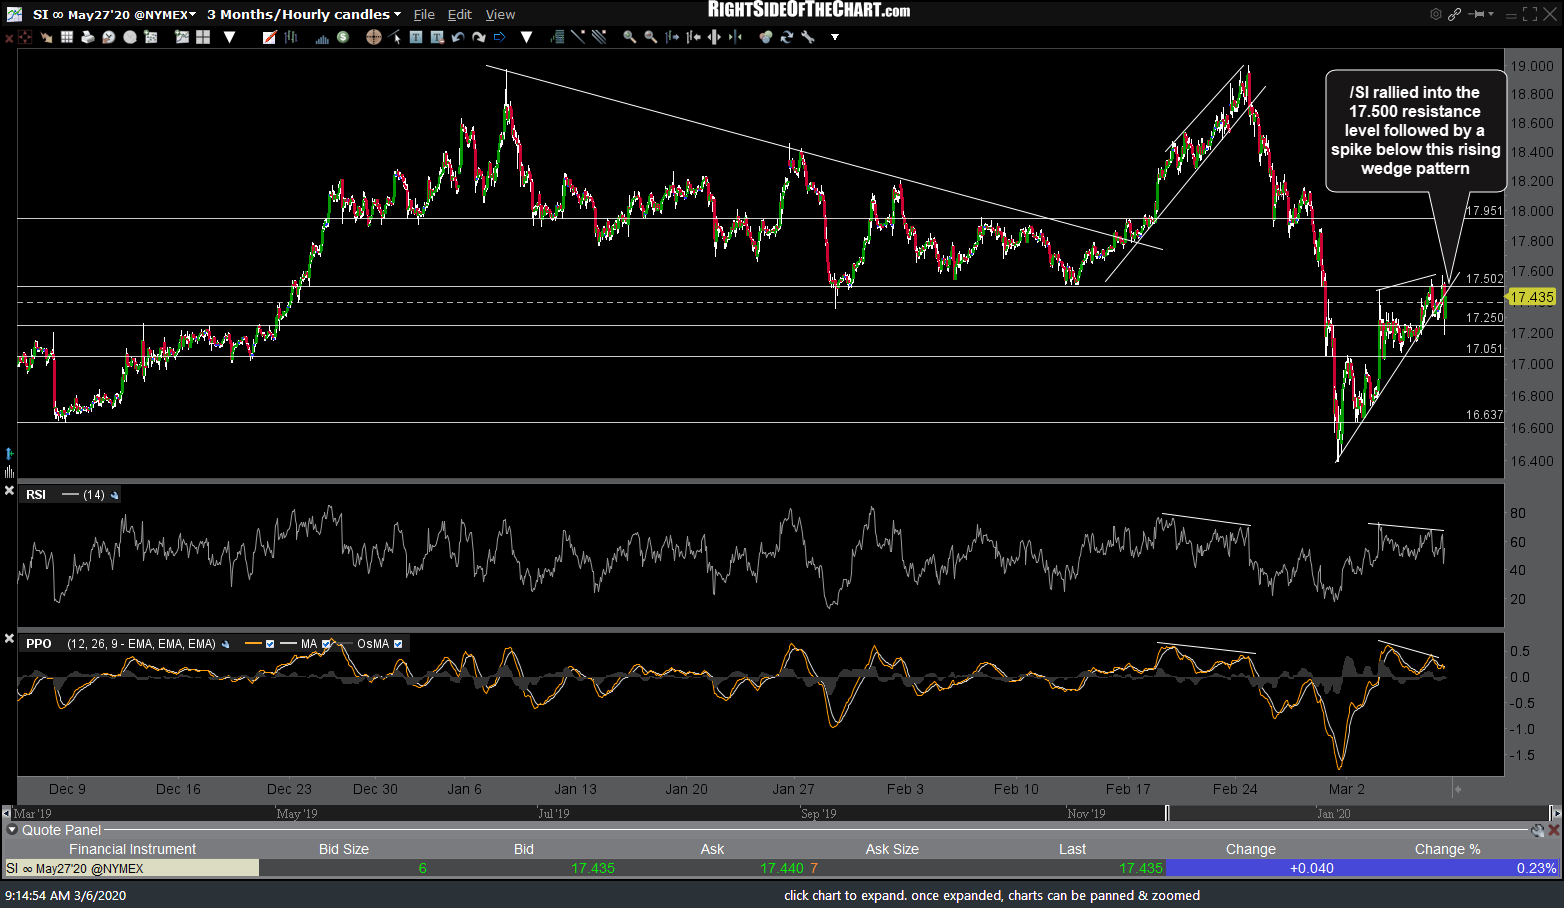
SI 60m March 6th
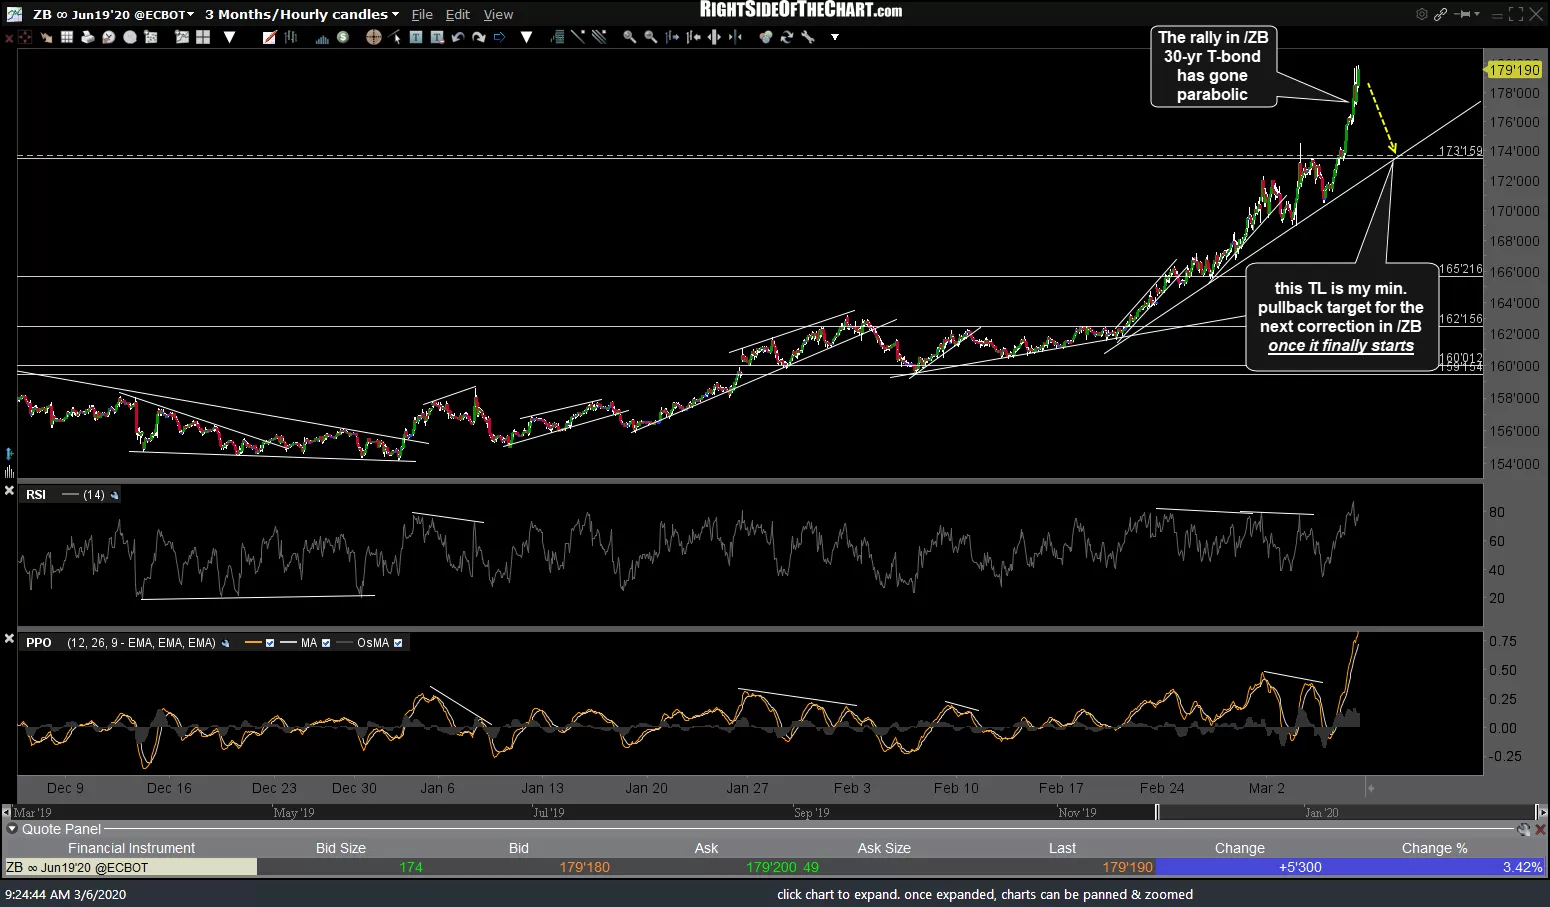
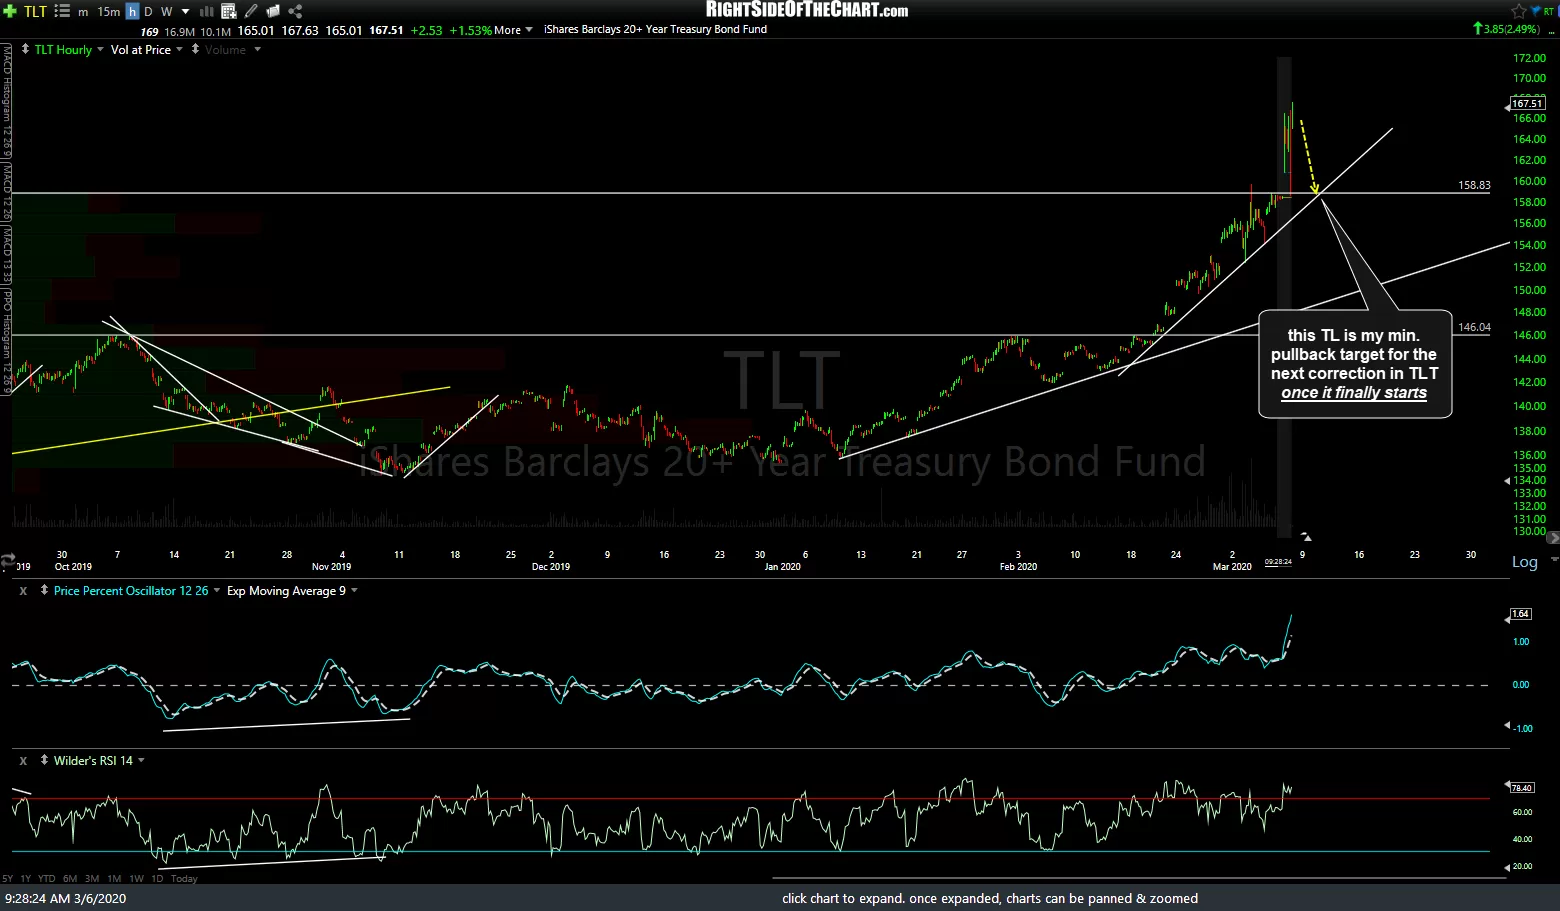
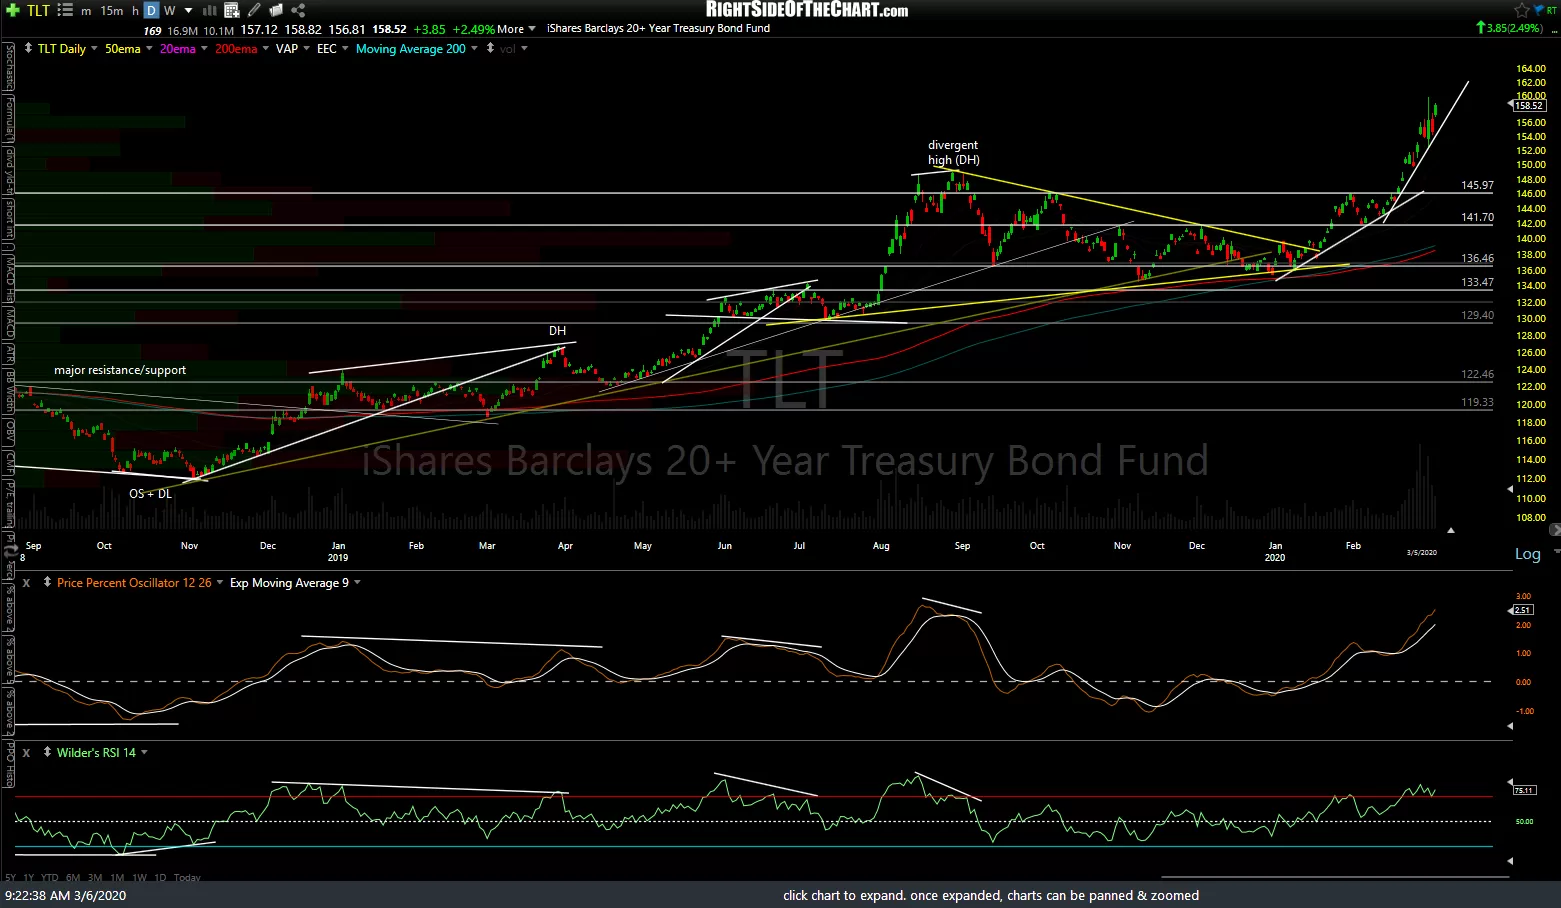
The rally in the 30-yr Treasury bond has gone parabolic. Hard to say exactly when Treasuries will reverse trend (although a half-decent bounce in the stock market would likely do the trick) but I’ve provided my minimum pullback targets for /ZB & TLT in the 60-minute & daily charts below.
-
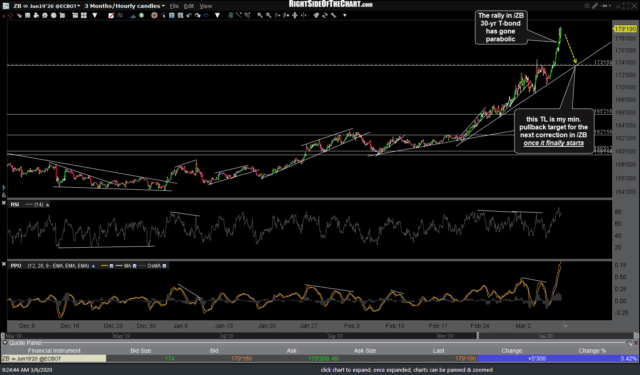
- ZB 60m March 6th
-
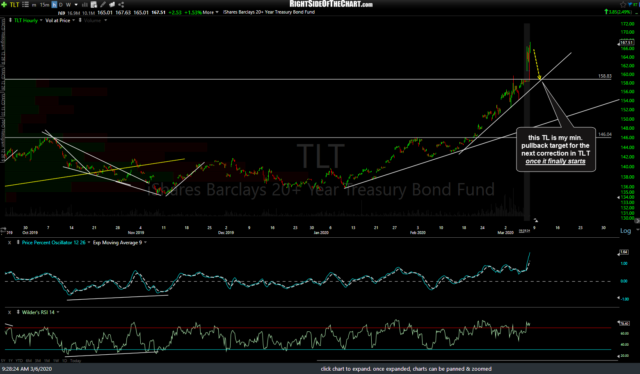
- TLT 60m March 6th
-
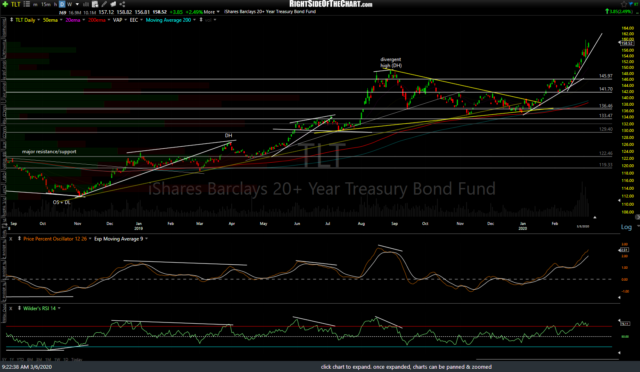
- TLT daily March 6th
Just to reiterate, the case for additional downside in the stock market has only strengthened since yesterday with the big slide in the stock futures overnight which in turn, caused SPY & QQQ to gap below Tuesday’s reaction lows, essentially negating or ending the near-term uptrend off last Friday’s lows. As such, the risk-off assets could have more upside or at least hold around current levels although the charts can change on a dime so I wanted to get these levels out in advance for those interested.