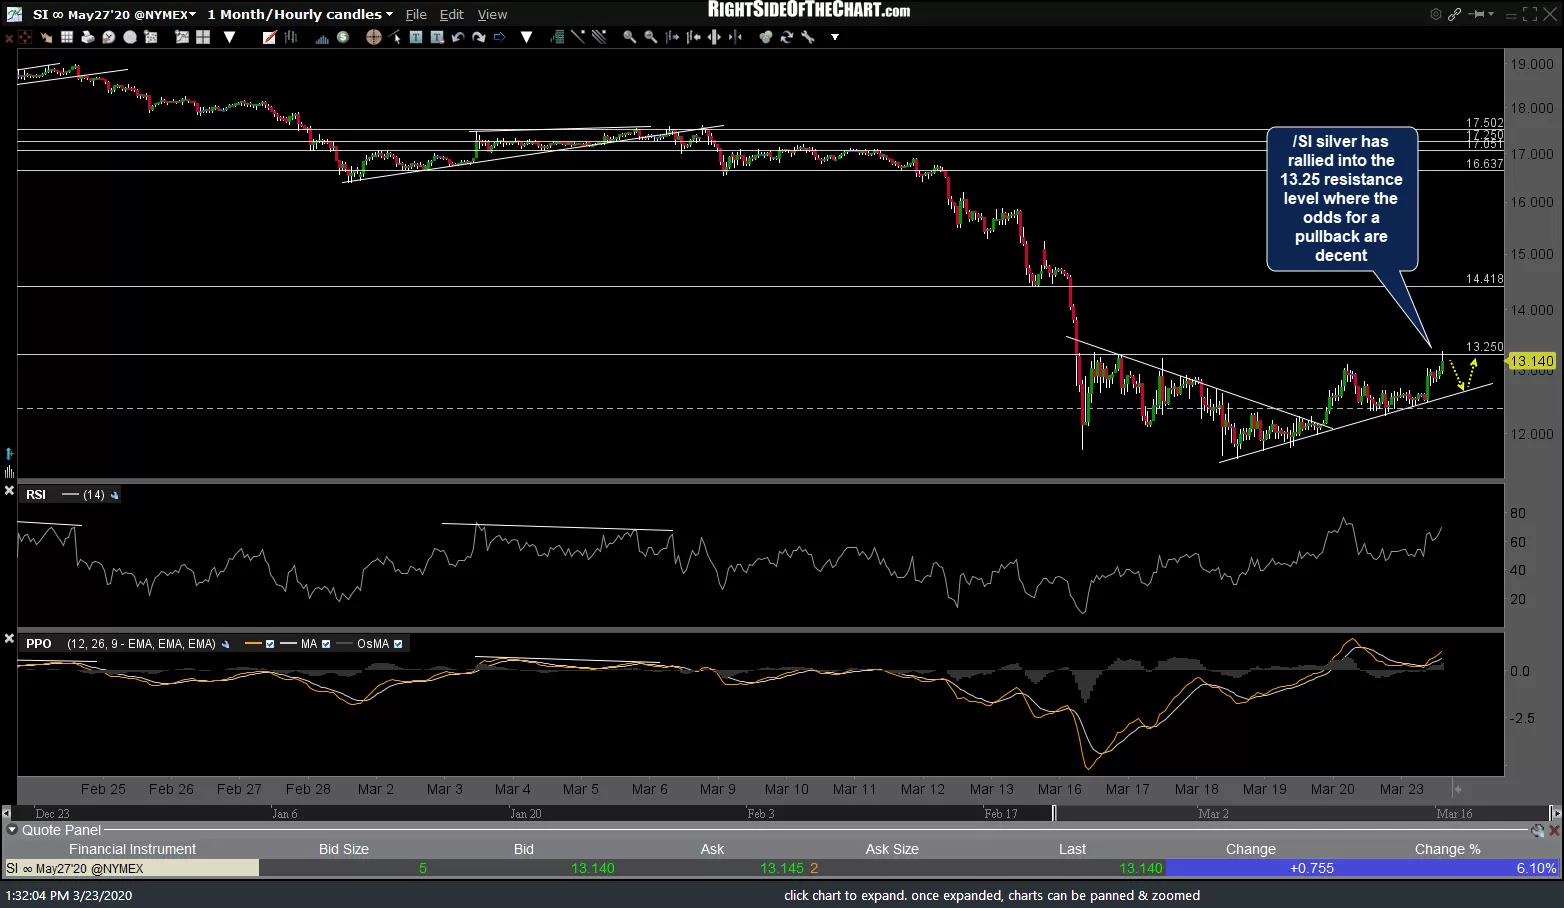
I plan to post comprehensive analysis of the precious metals soon but until then, I wanted to pass along these charts of gold & silver futures as both are posting strong gains today but have rallied into resistance levels where the odds for a reaction are decent (good but not great).
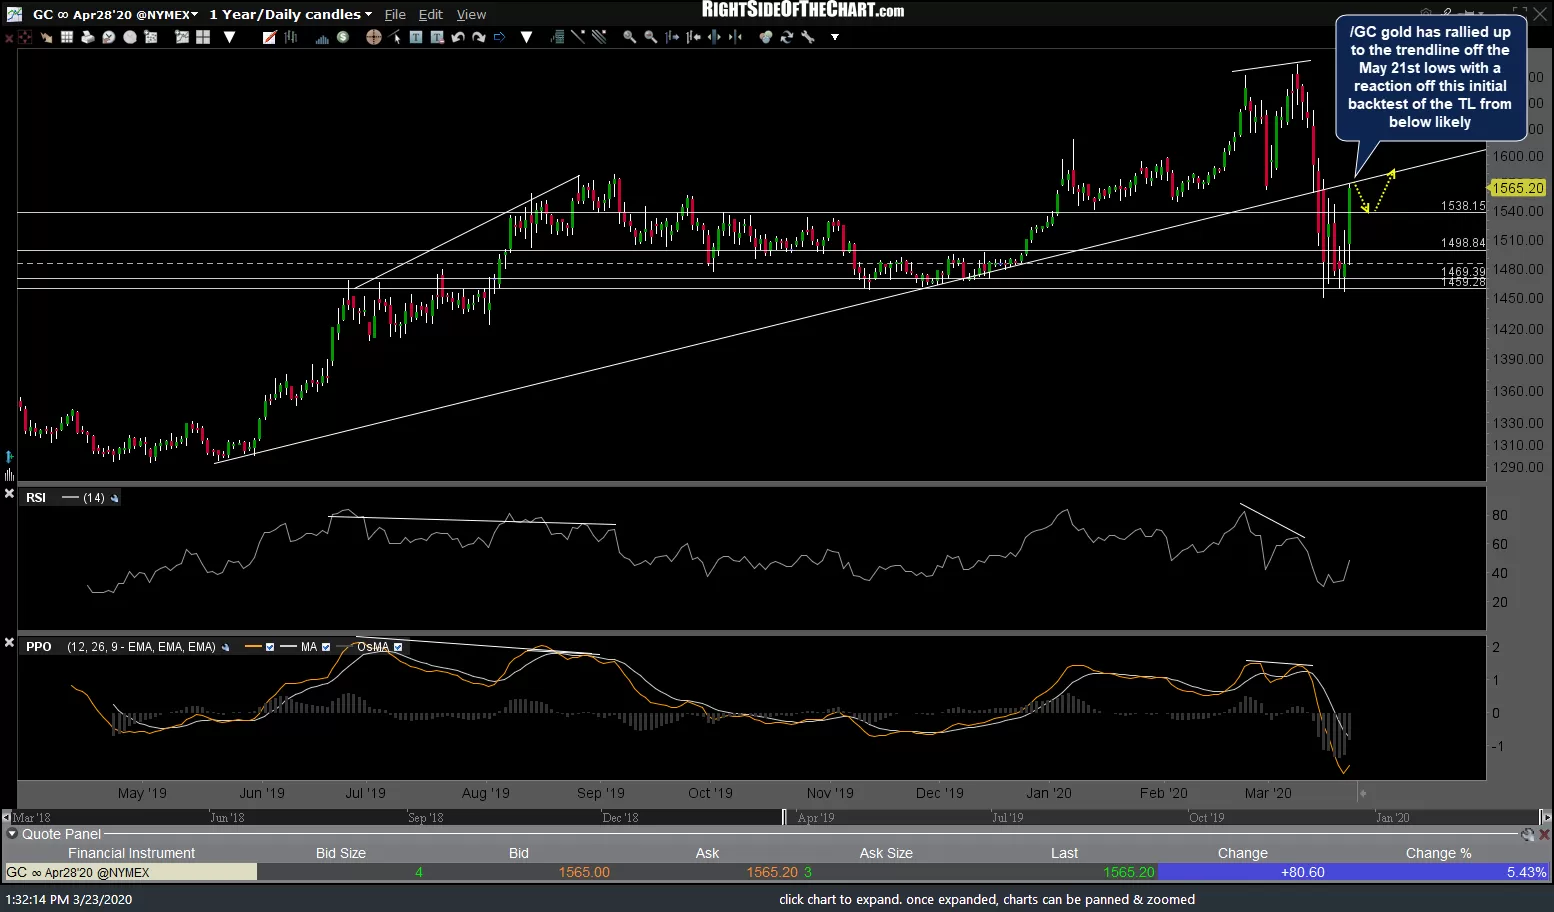
GLD (gold ETF) remains an Active Long Swing Trade and I remain intermediate to longer-term bullish on gold but just wanted to share these levels for active traders that might want to either tighten up stops or book profits on a long position (and maybe recycle back in on a pullback) as well as those that might want to take a shot at a pullback short trade here at resistance with stops somewhat above. Again, no changes will be made to the GLD active long trade at this time as I the charts remain constructive at this time, whether or not we get a tradable pullback off these levels, assuming that any pullback is contained on the support levels indicated below. Daily & 60-minute charts of /GC (gold futures) followed by the 60-minute chart of /SI (silver futures) below.
-

- GC daily March 23rd
-
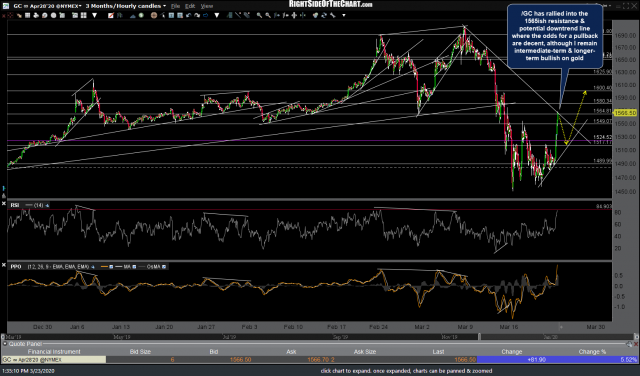
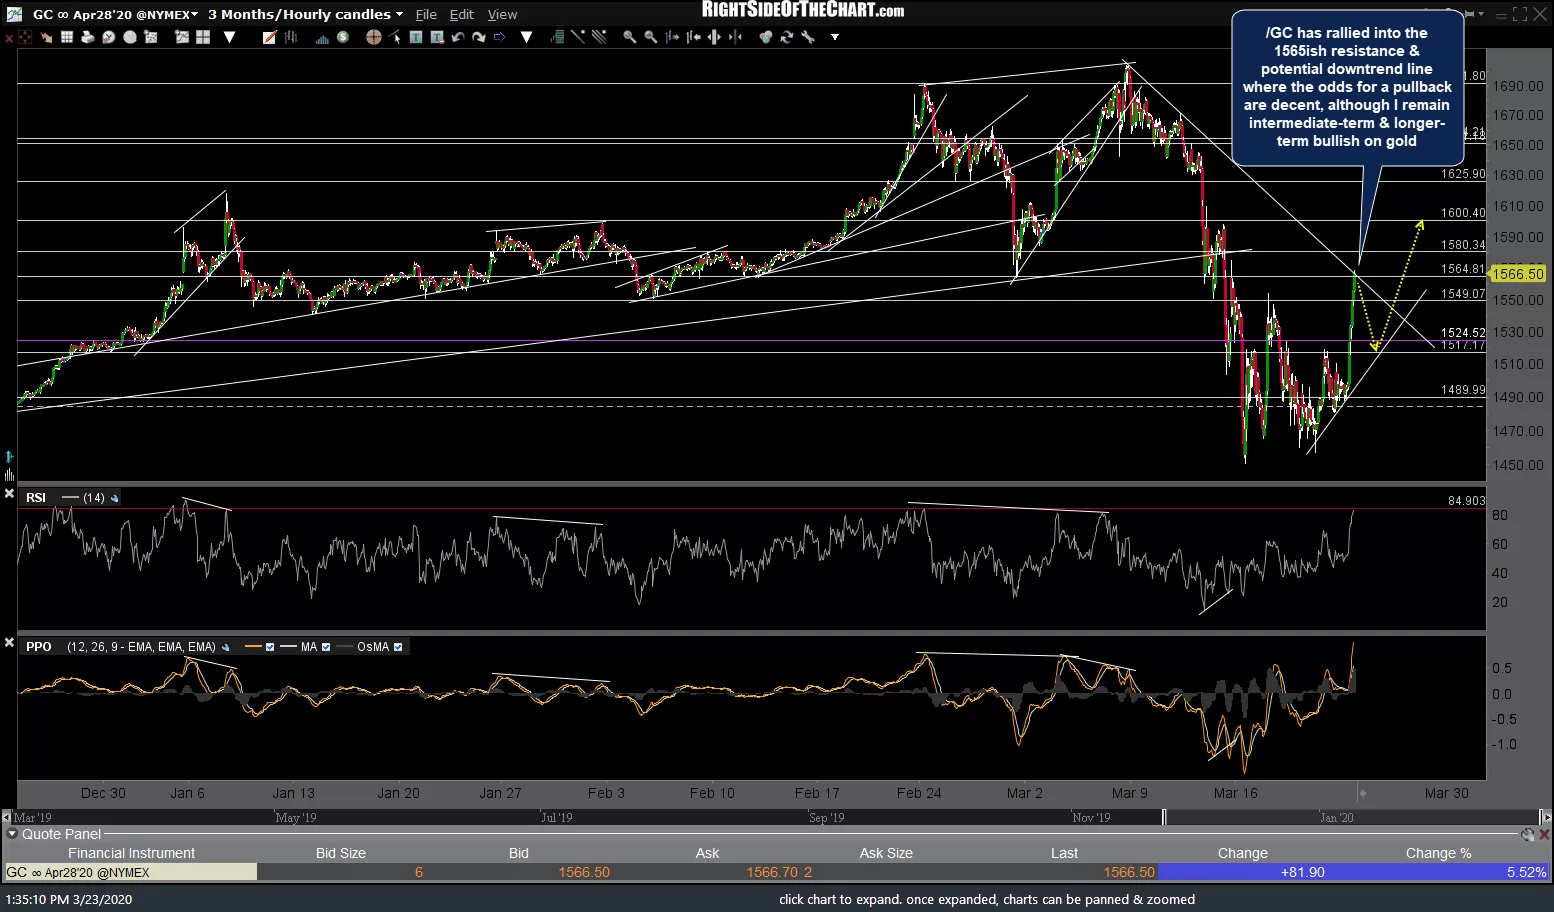
- GC 60m March 23rd
-
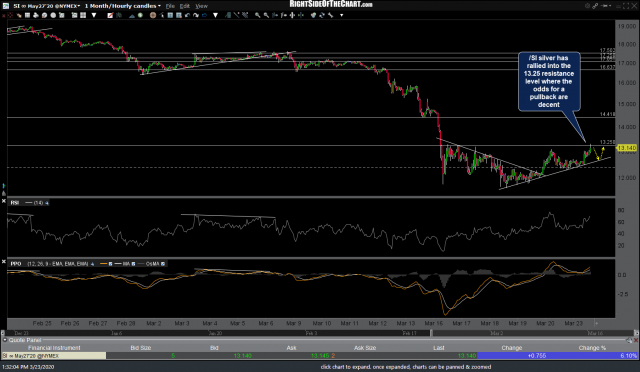
- SI 60m March 23rd