
As with the other precious metals, /GC gold futures appears headed lower in the coming days to weeks but I’m about 50/50 on whether it breaks out above this falling wedge & rallies before then or continues to work down within the wedge to the 4500 support before the next decent rally. Ditto for /SI silver. 60-minute charts below.
-

- GC 60m Sept 9th

-

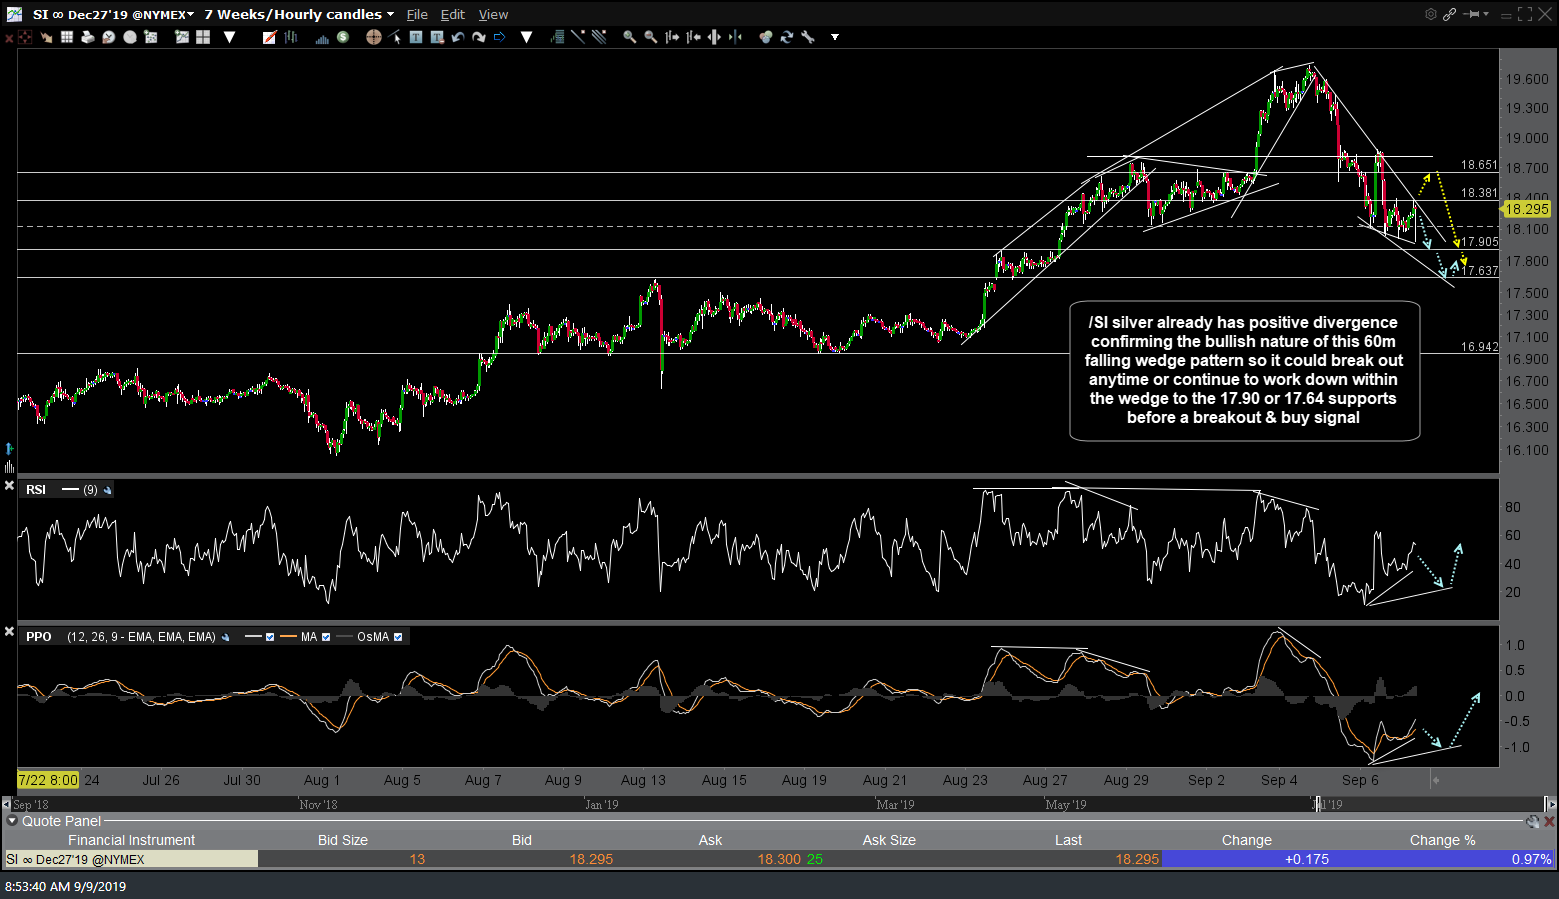
- SI 60-min Sept 9th
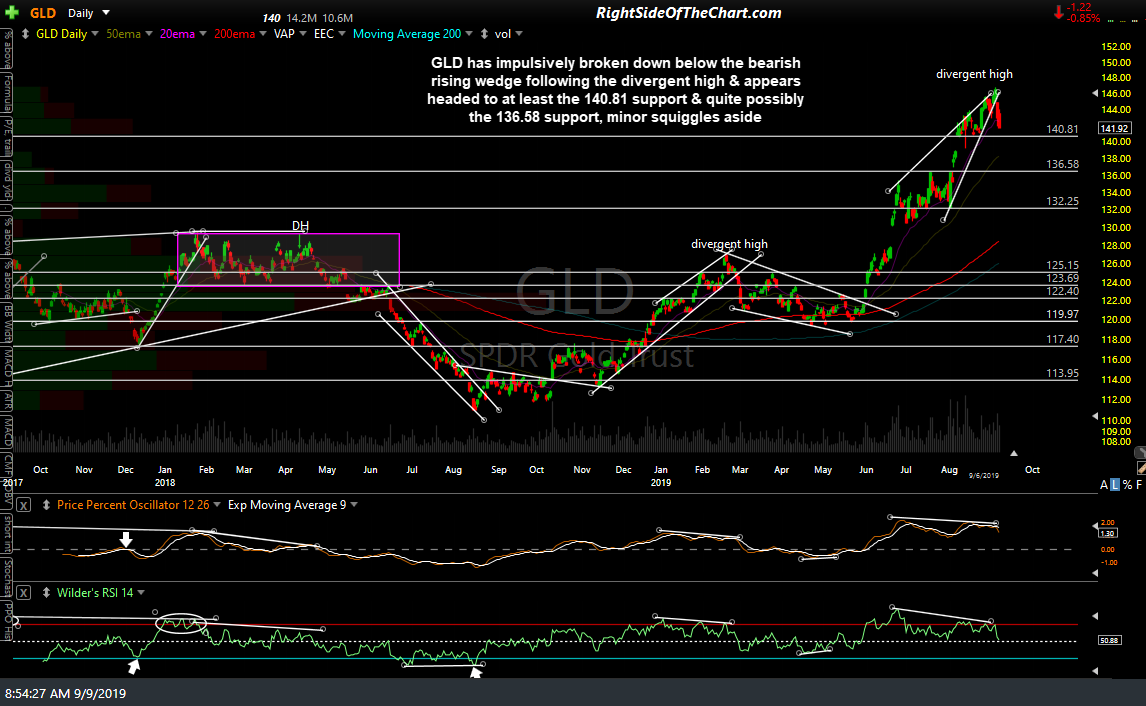
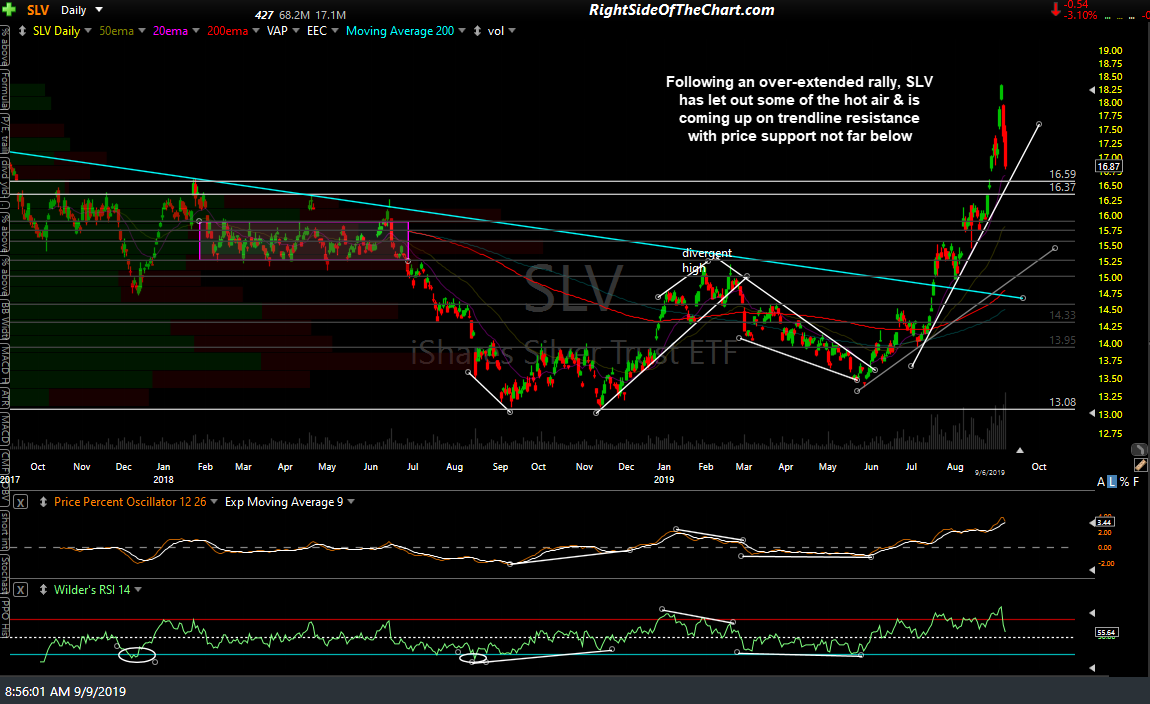
On the daily charts of the gold & silver ETFs below, GLD has impulsively broken down below the bearish rising wedge following the divergent high & appears headed to at least the 140.81 support & quite possibly the 136.58 support, minor squiggles aside, while following an over-extended rally, SLV has let out some of the hot air & is coming up on trendline resistance with price support not far below.
-

- GLD daily Sept 9th
-

- SLV daily Sept 9th
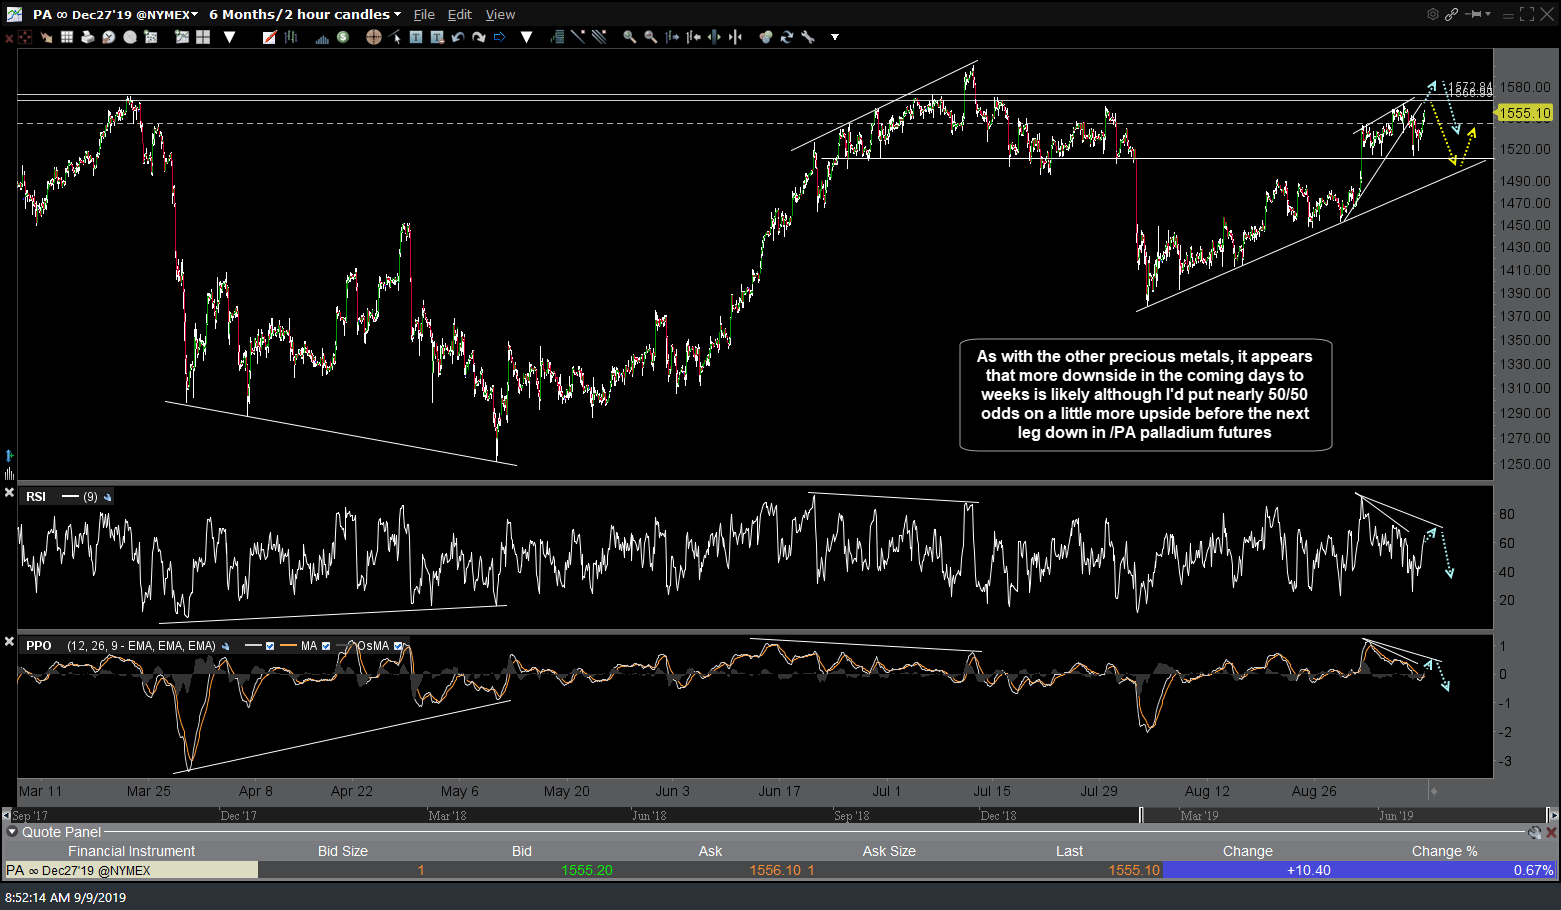
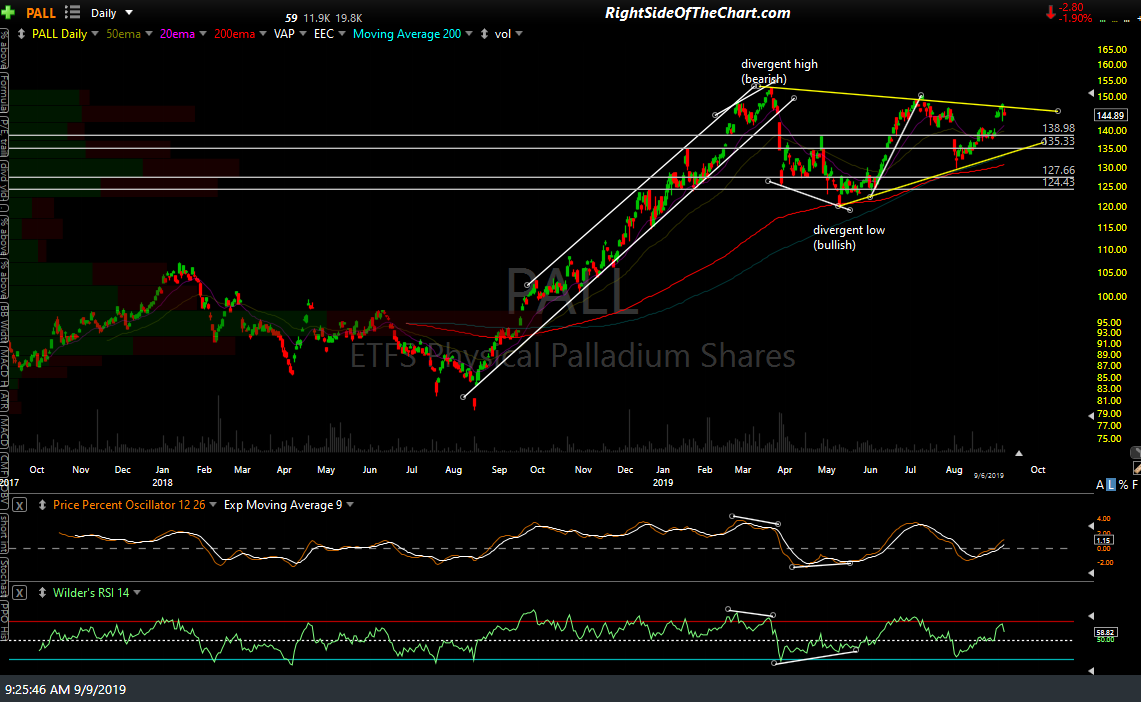
As with the other precious metals, it appears that more downside in the coming days to weeks is likely although I’d put nearly 50/50 odds on a little more upside before the next leg down in palladium. 60-minute chart of /PA (palladium futures) and daily chart of PALL (palladium ETF) below.
-

- PA 60-min Sept 9th
-
- PALL daily Sept 9th
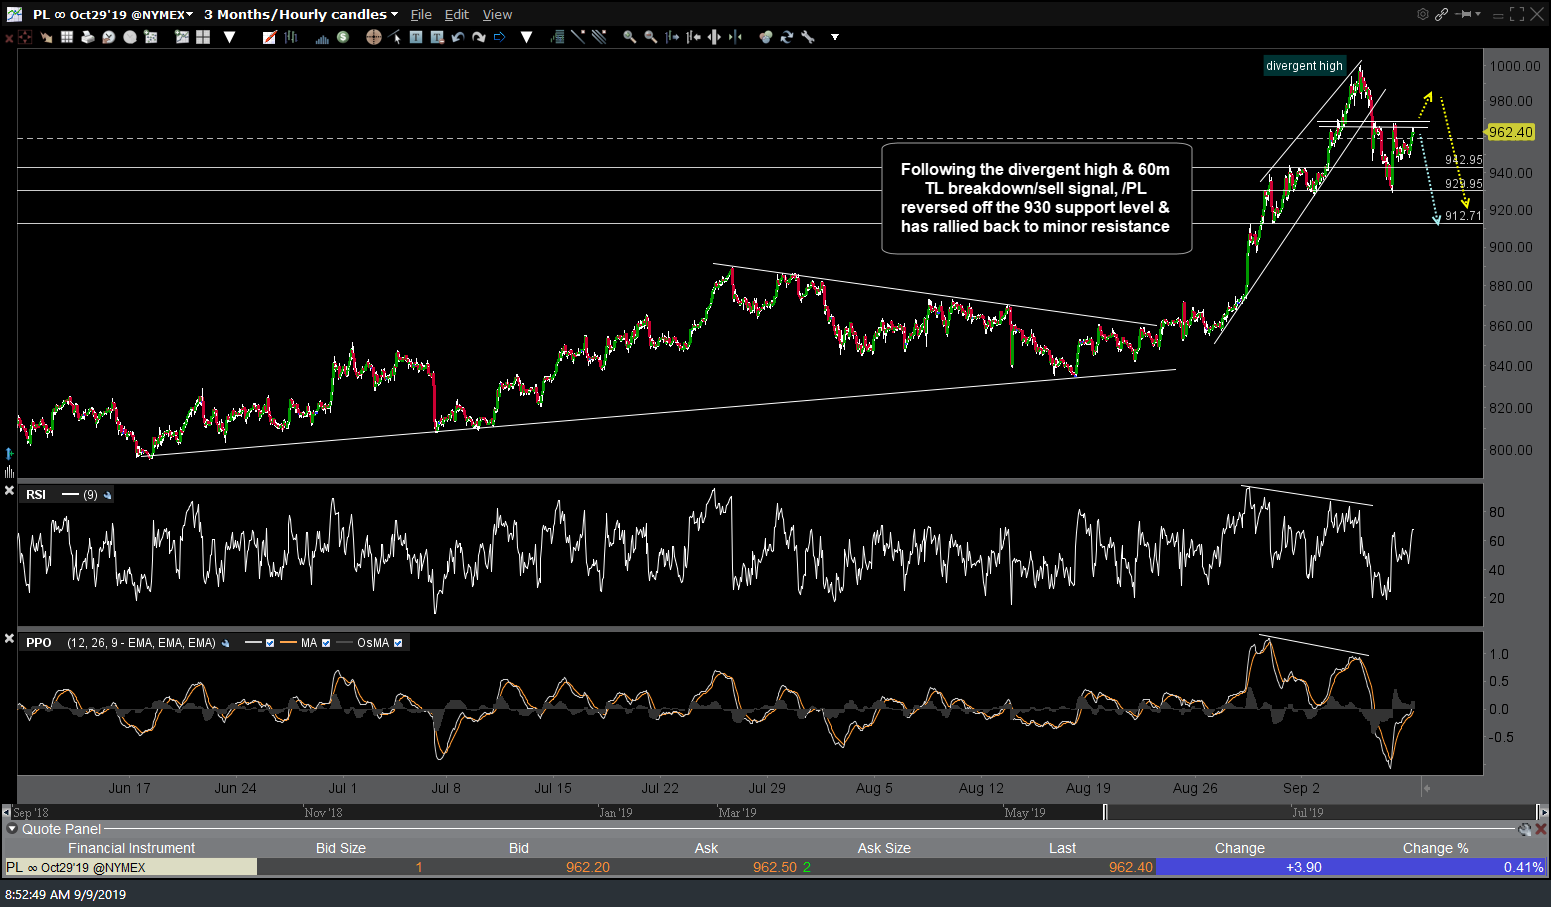
Following the divergent high & 60-minute trendline breakdown & sell signal, /PL (platinum futures) reversed off the 930 support level & has rallied back to minor resistance while PPLT (platinum ETF) is coming off the 5 overbought reading over the past 2-years on the daily chart below.
-

- PL 60-min Sept 9th
-

- PPLT daily Sept 9th
