
As the US Dollar continues to slide, there are some developments & key technical levels worth noting on the Dollar sensitive (and $USD alternative) assets; gold, silver, & Bitcoin. Starting with the long-term weekly chart, GLD is approaching the top of the 174-186 resistance zone & previous bull market top, very significant resistance, as negative divergences continue to build between price & the momentum indicators. Sell signal to come on a solid break and/or weekly close below this uptrend line.
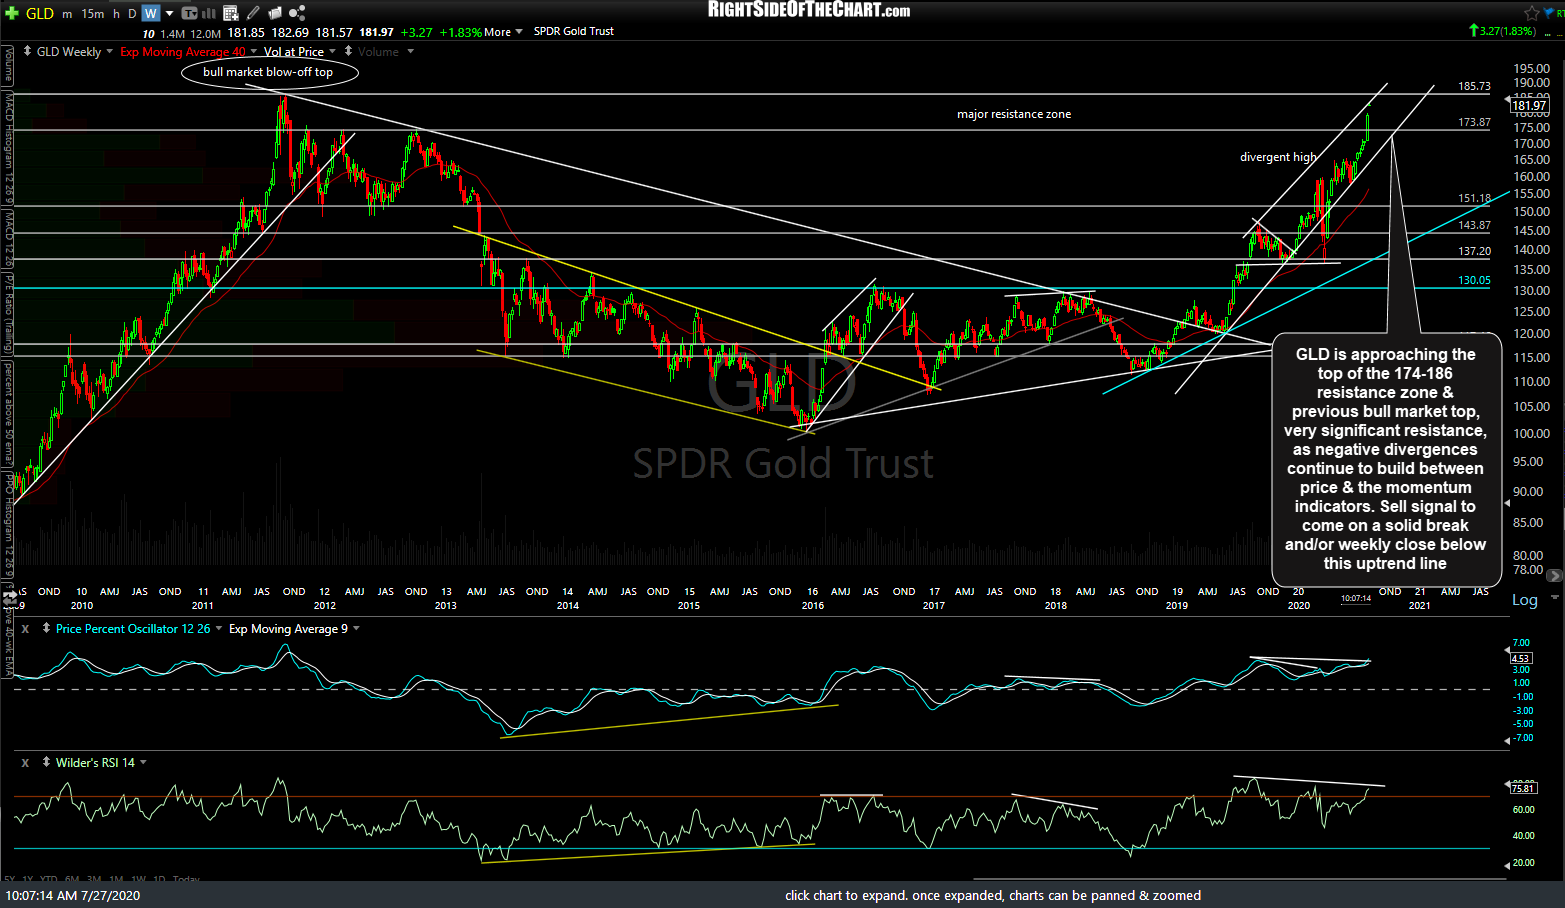
GLD weekly July 27th
While waiting for confirmation of a sell signal on a weekly chart, which entails a weekly (end of trading on Friday) close below the support level and/or any potential topping/reversal candles on the weekly charts, the shorter-term charts are useful for providing earlier buy & sell signals, although the downside is that the chance of whipsaw signal increases as the shorter the time frame used to provide the signal. On the /GC (gold futures) 60-minute chart, I am still awaiting a solid break and/or 60-minute close below this trendline for a sell signal gold with potential targets shown at the arrow breaks.
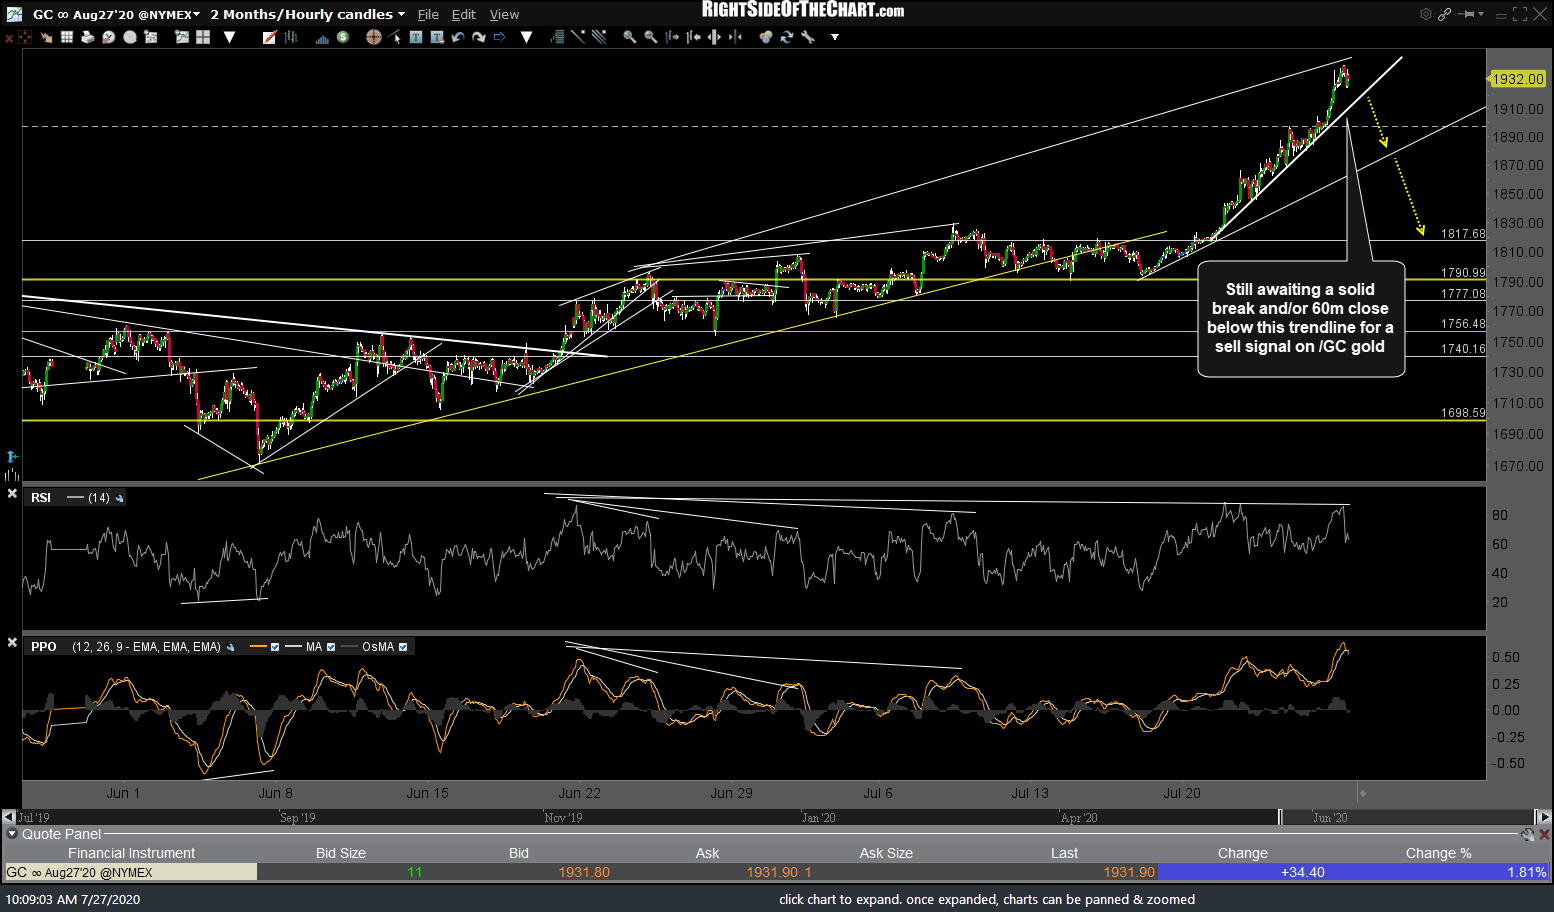
GC 60m July 27th
Silver is coming up on the major long-term 26ish resistance on this long-term weekly chart where a reaction is likely. Prices are reflective as of Friday’s close as this is an EOD or end-of-day chart. Currently, silver futures are trading at 24.45, or roughly 6% below the 26ish resistance level.
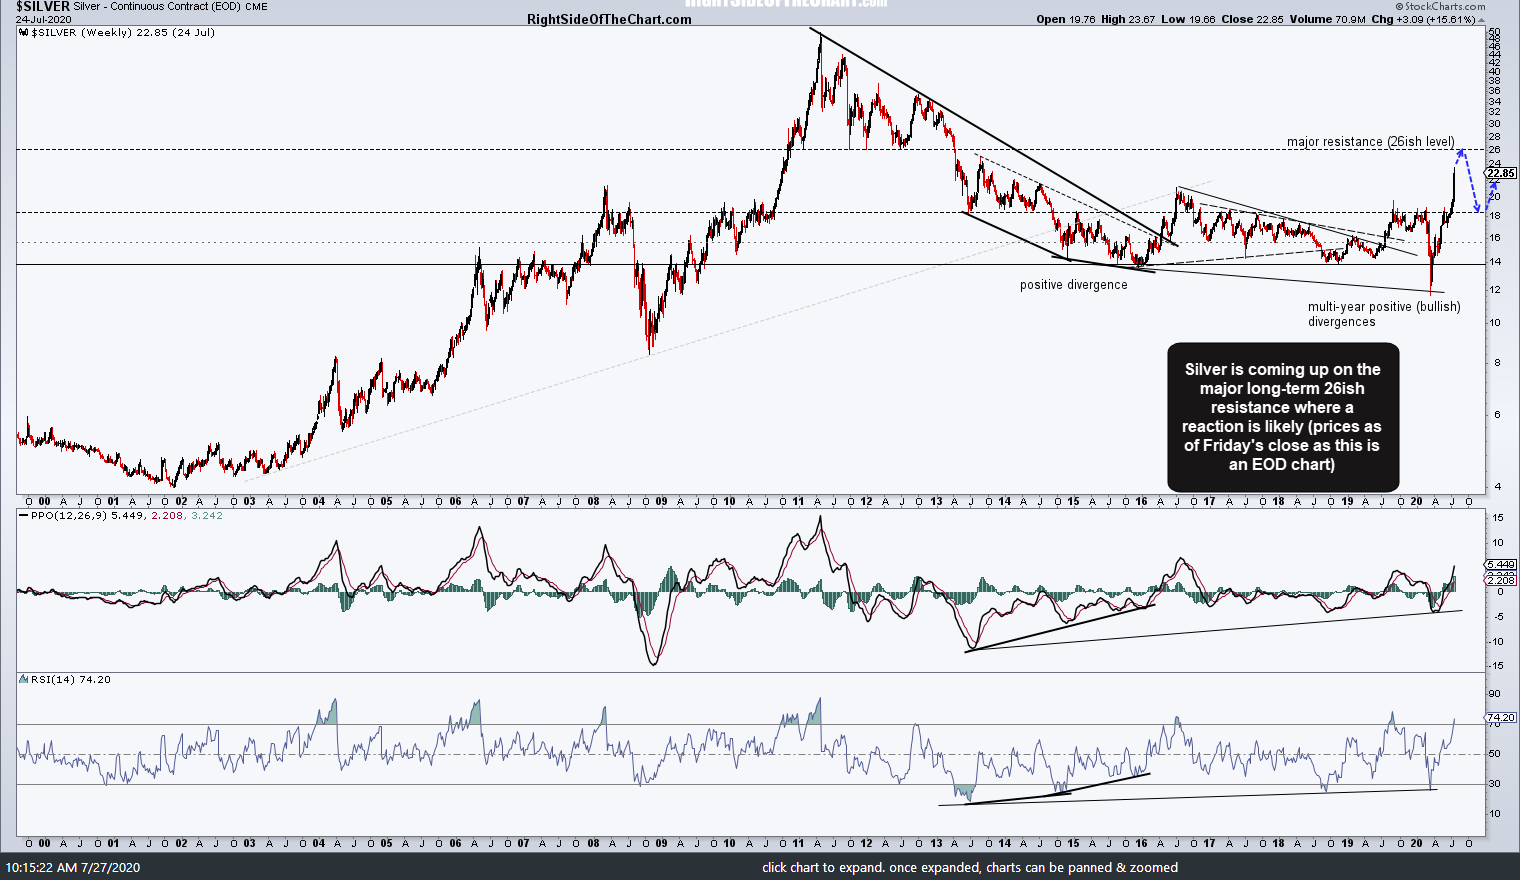
$SILVER weekly July 24th close
Zooming down to the 60-minute time frame, sell signals on /SI silver to come on a break below this uptrend line & then the 22.56ish support although a rally into the 26ish key long-term resistance level before then would also offer an objective short entry or exits on any long positions.
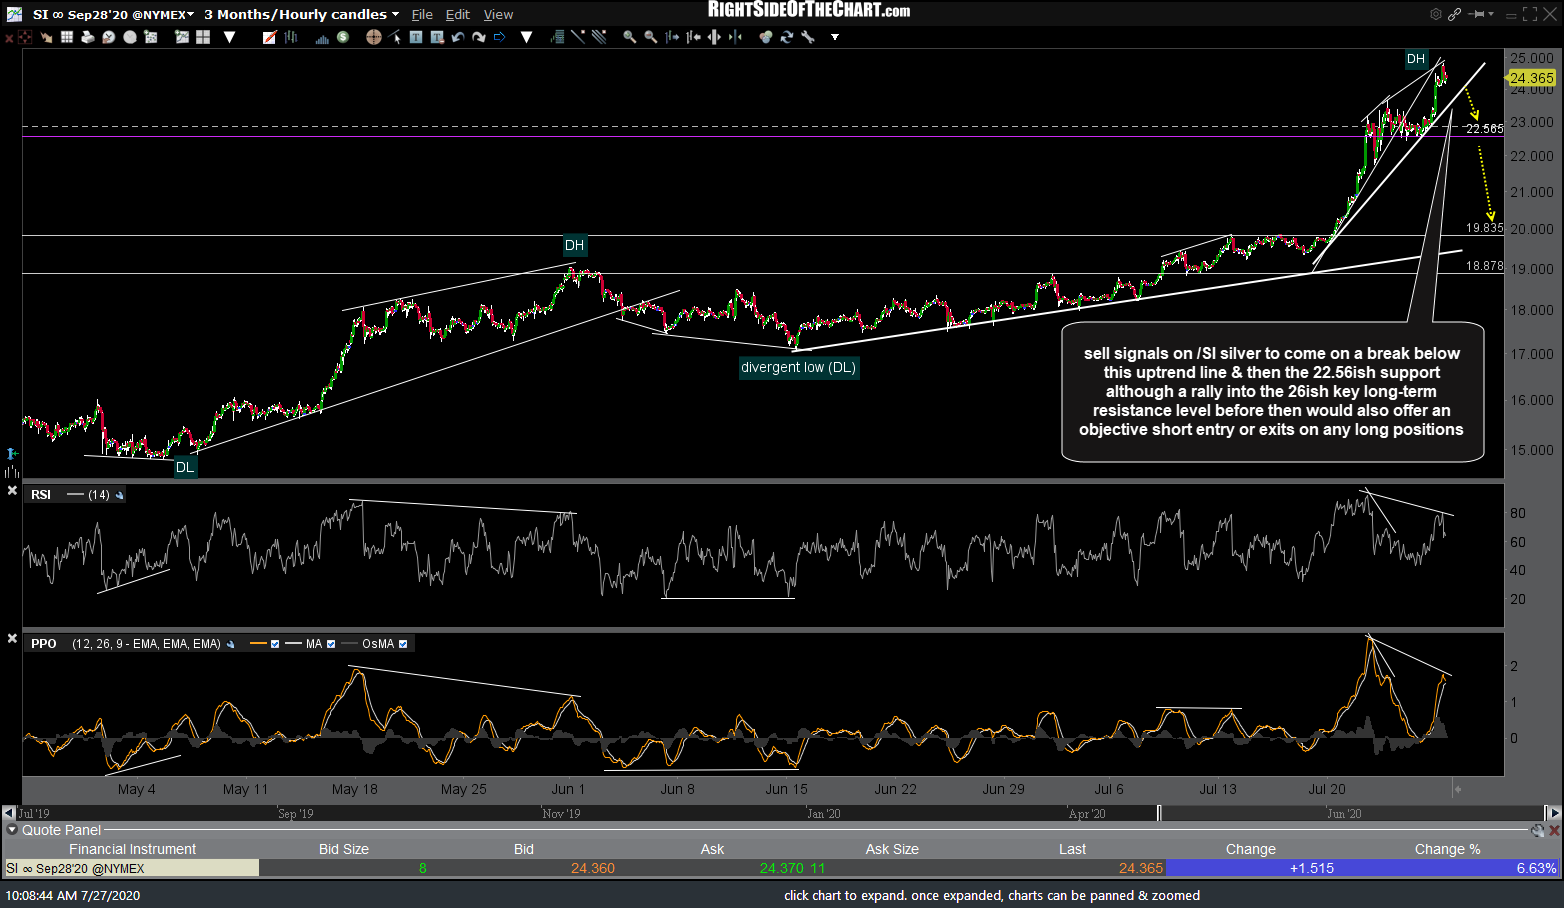
SI 60m July 27th
Another $US Dollar alternative, Bitcoin, is also benefiting from the recent flight out of the Greenback recently. /BRR (Bitcoin futures) is rallying impulsively today after breakout out above this symmetrical triangle pattern as it approaches the 10718ish resistance level on this daily chart.
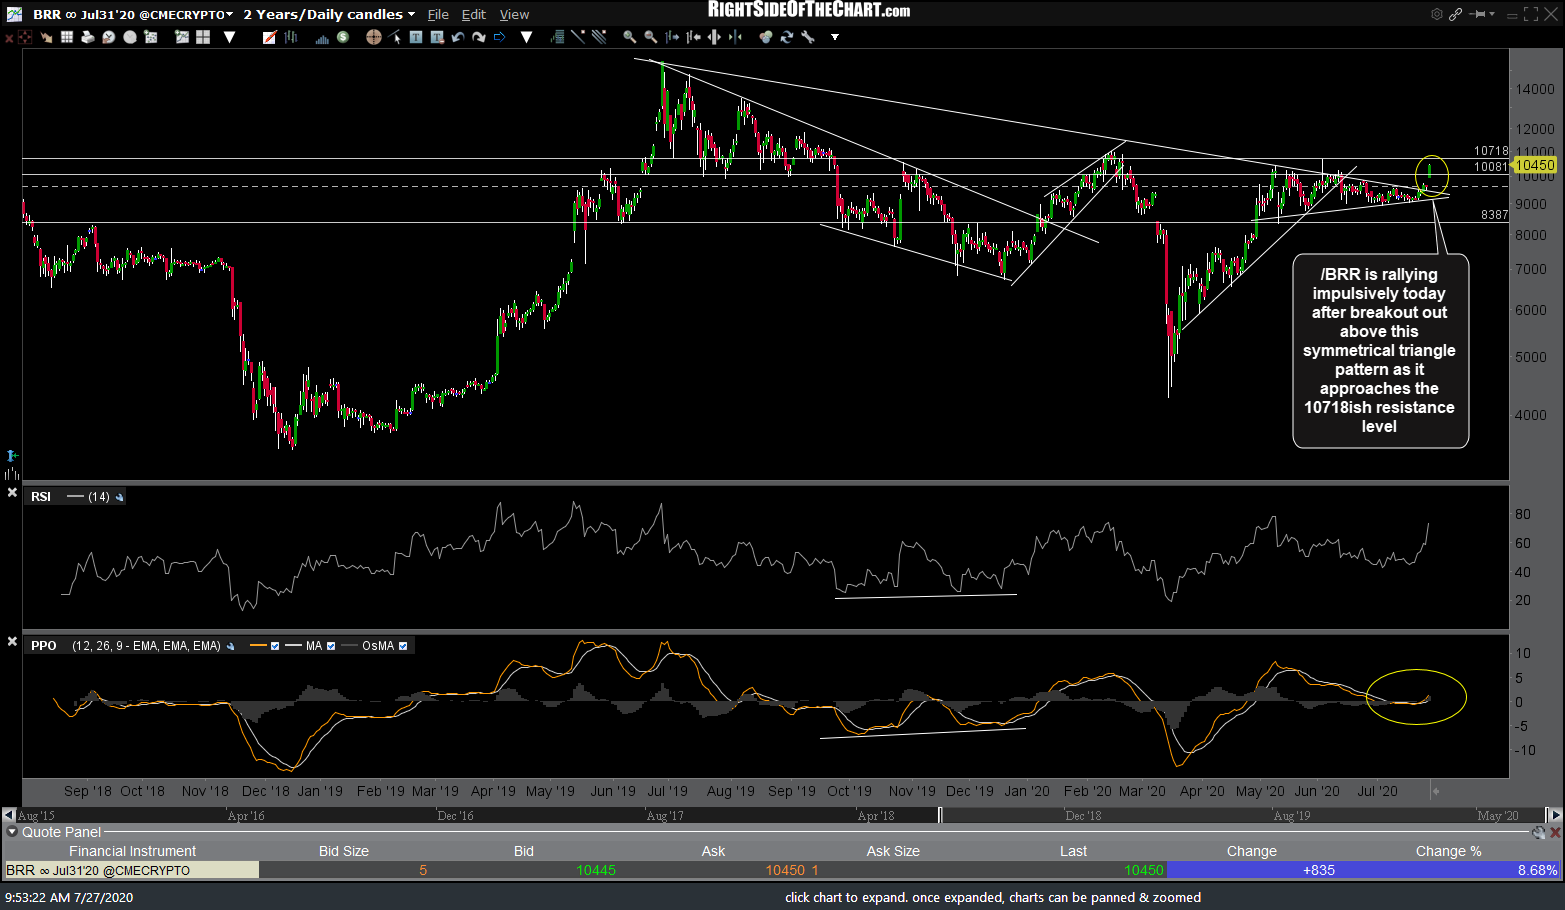
BRR daily July 27th
Likewise, GBTC (Bitcoin Trust) has broken out above the downtrend line but with the signification 12.19 resistance just overhead on this daily time frame.

GBTC daily July 27th