So far, so good with GLD (gold ETF) reversing immediately after Monday’s Time To Start Scaling Back Into Gold post & rallying impulsively since. GLD has closed posted solid gains every day since then, rallying about 4½% so far, with SLV (silver ETF) gaining about 9½% since then (silver will typically rise & fall more than gold during rallies & corrections). Previous & updated daily charts below.
Click on the first chart to expand. Once expanded, charts can be panned & zoomed for additional detail.
-
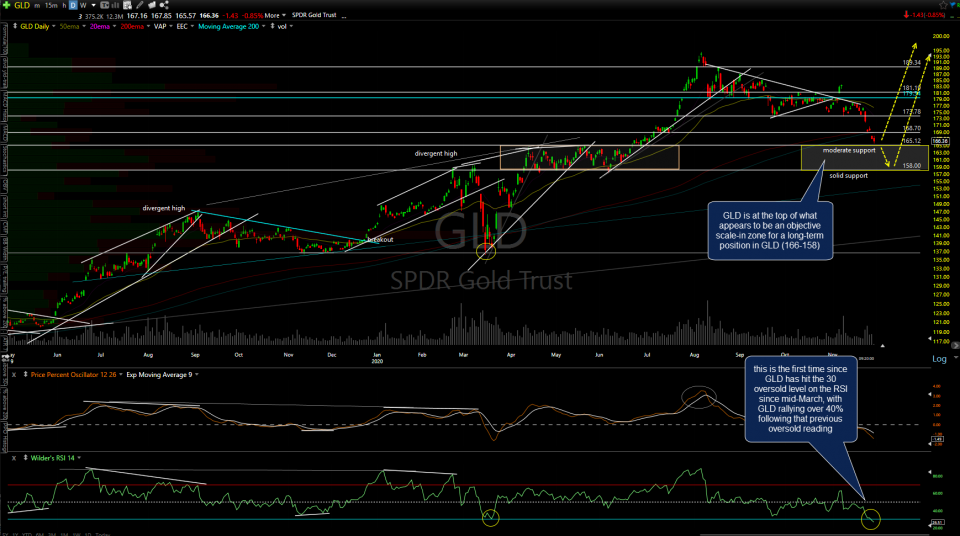
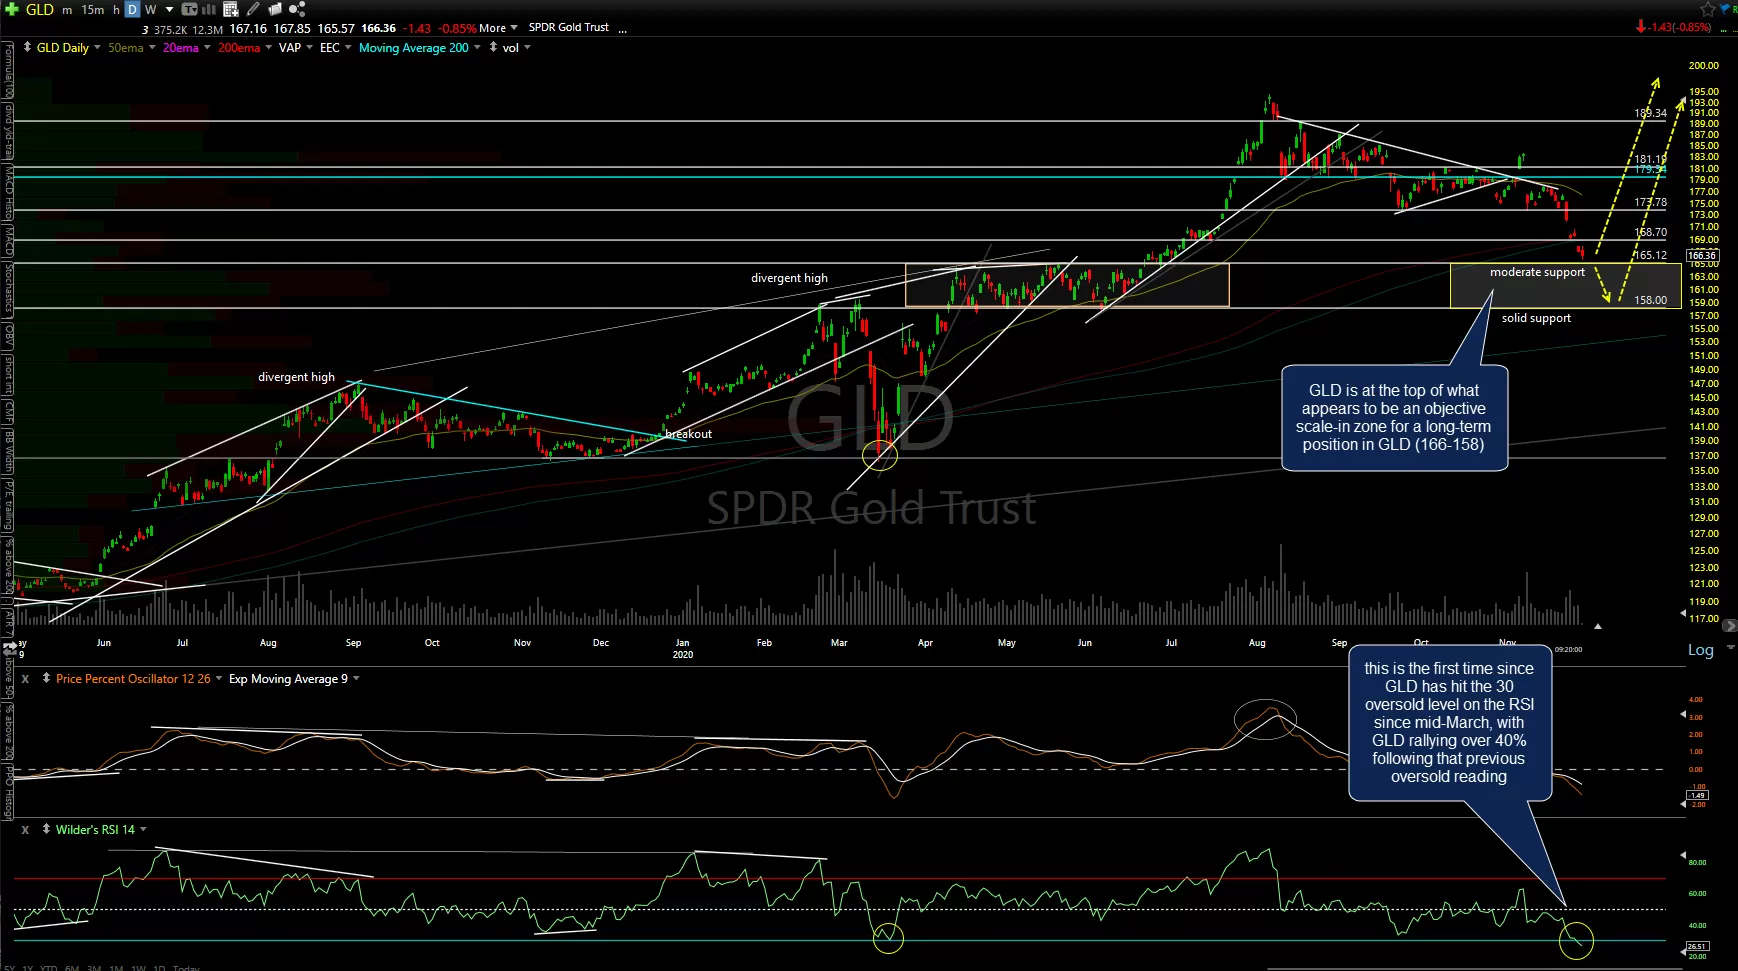
- GLD daily Nov 30th
-
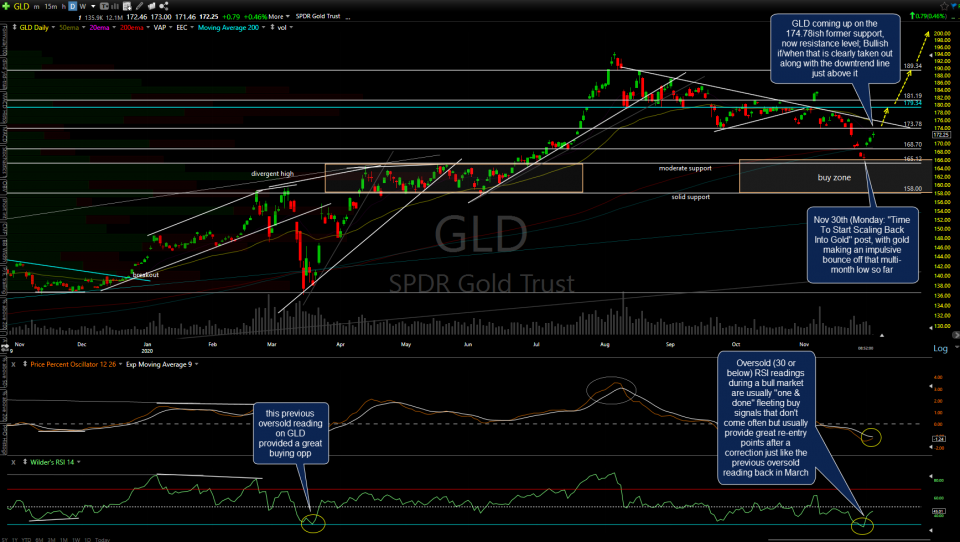
- GLD daily Dec 3rd
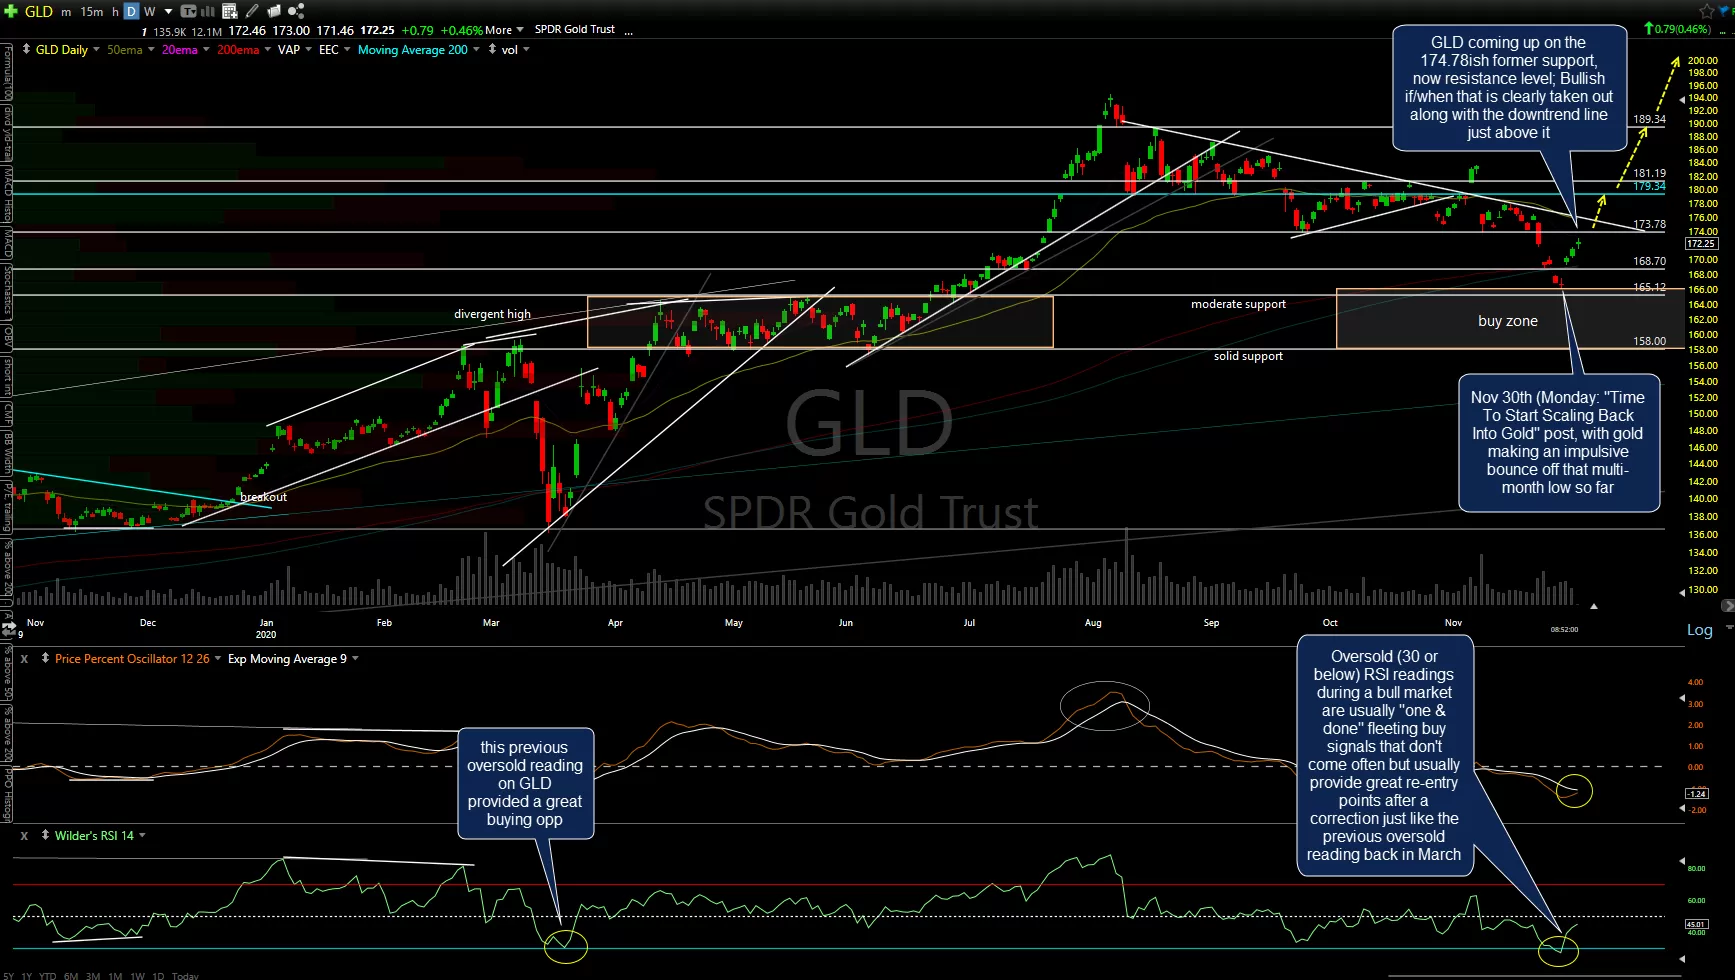
GLD is coming up on the 174.78ish former support, now resistance level; Bullish if/when that is clearly taken out along with the downtrend line just above it. As such, active traders that took a position on Monday could opt to book quick profits on either metal if/when GLD gets a little closer to the 173.78ish resistance although my preference remains to continue scaling into the metals & miners, on either strength or weakness (down to but not below the bottom of the 166-158 scale-in zone) strategically as long-term positions.
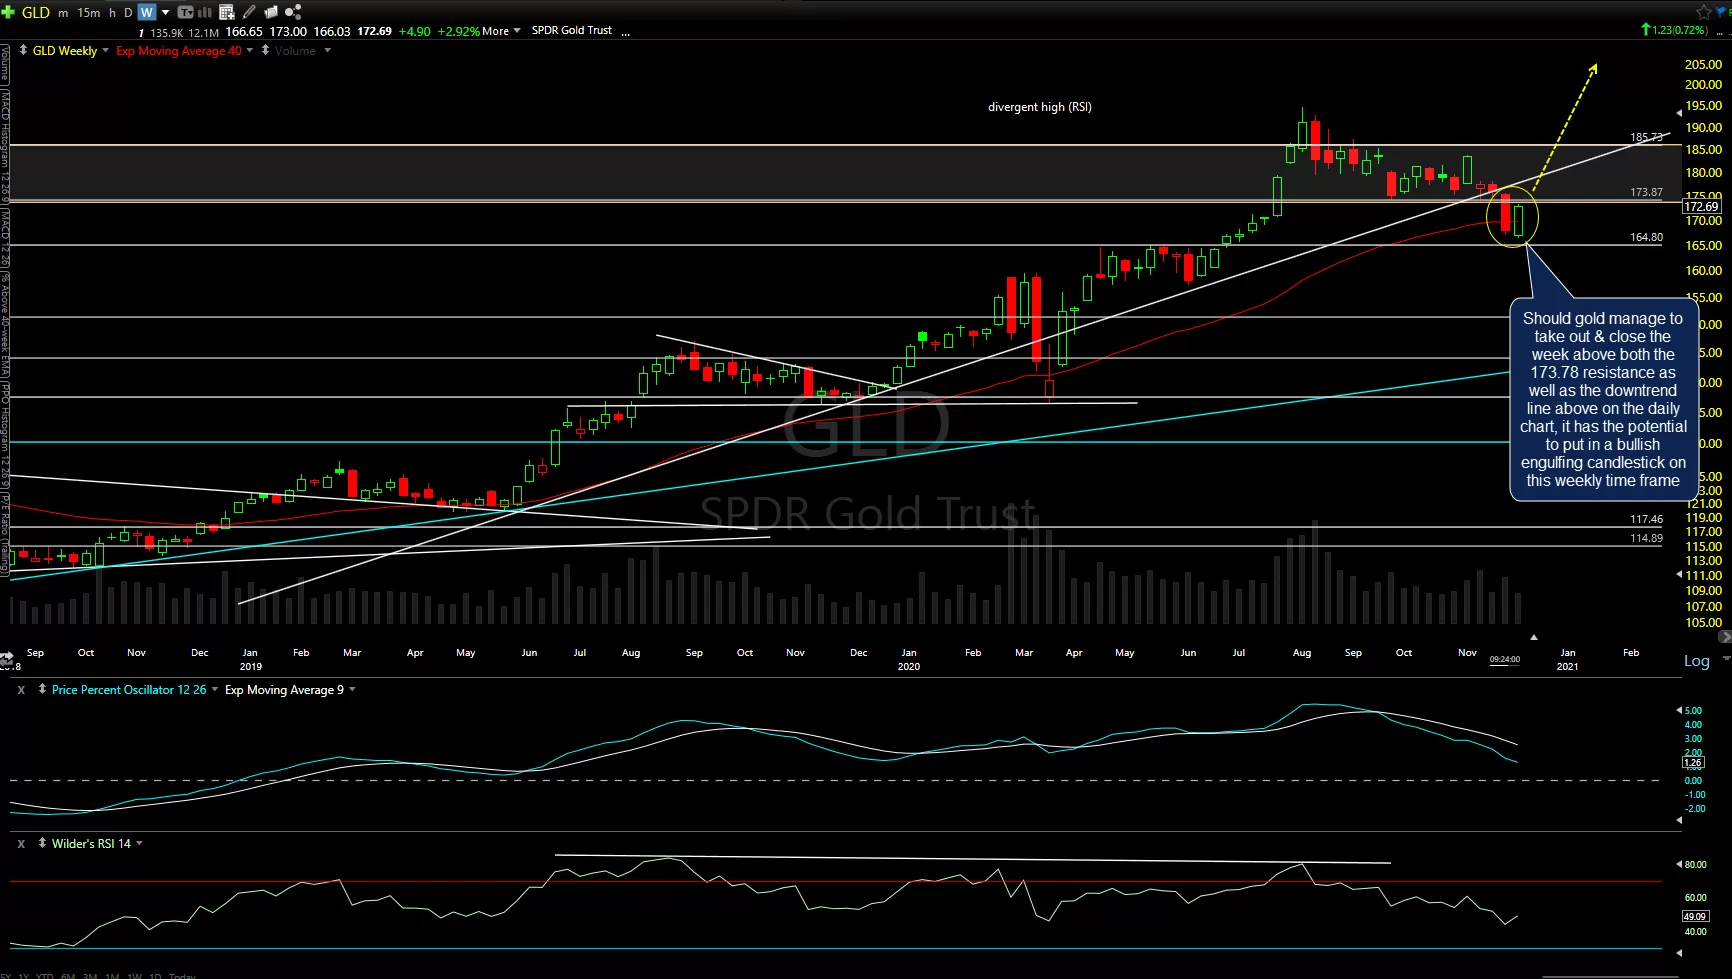
The term “strategically” scaling in means adding to positions on pullbacks to support and/or breakouts above resistance although those without the time to closely follow the charts throughout the day might opt to use a basic scale-in strategy in which you add predetermined amounts into the metals and/or miners over a pre-determined time intervals (e.g.- $5k every week for the next 8 weeks if your intention was to gradually take a $40k position over 2 months). Should gold manage to take out & close the week above both the 173.78 resistance as well as the downtrend line above, it has the potential to put in a bullish engulfing candlestick on the weekly time frame. Previous & updated weekly charts below.
charts in a ‘gallery’ format, like those above & below, will not appear on the new post email notifications but may be viewed on rsotc.com (short url)
-
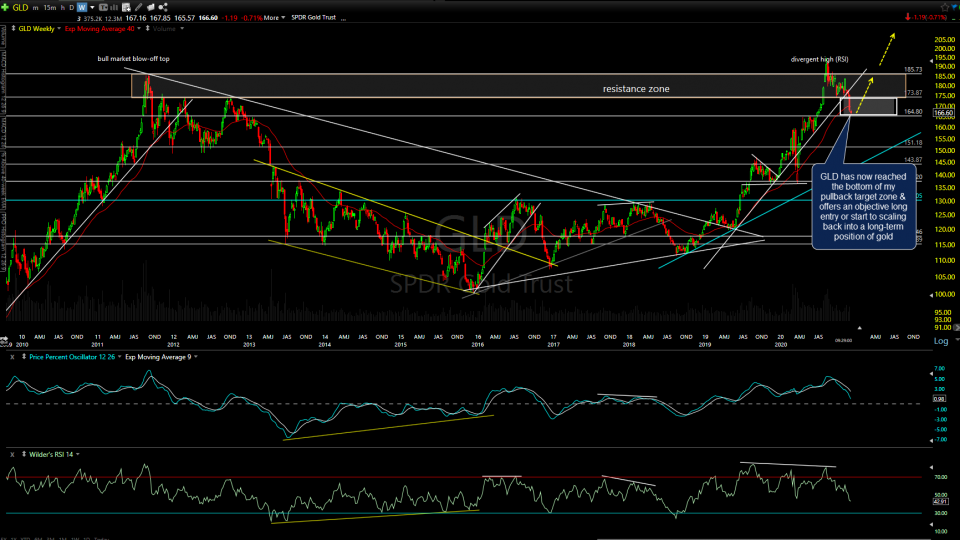
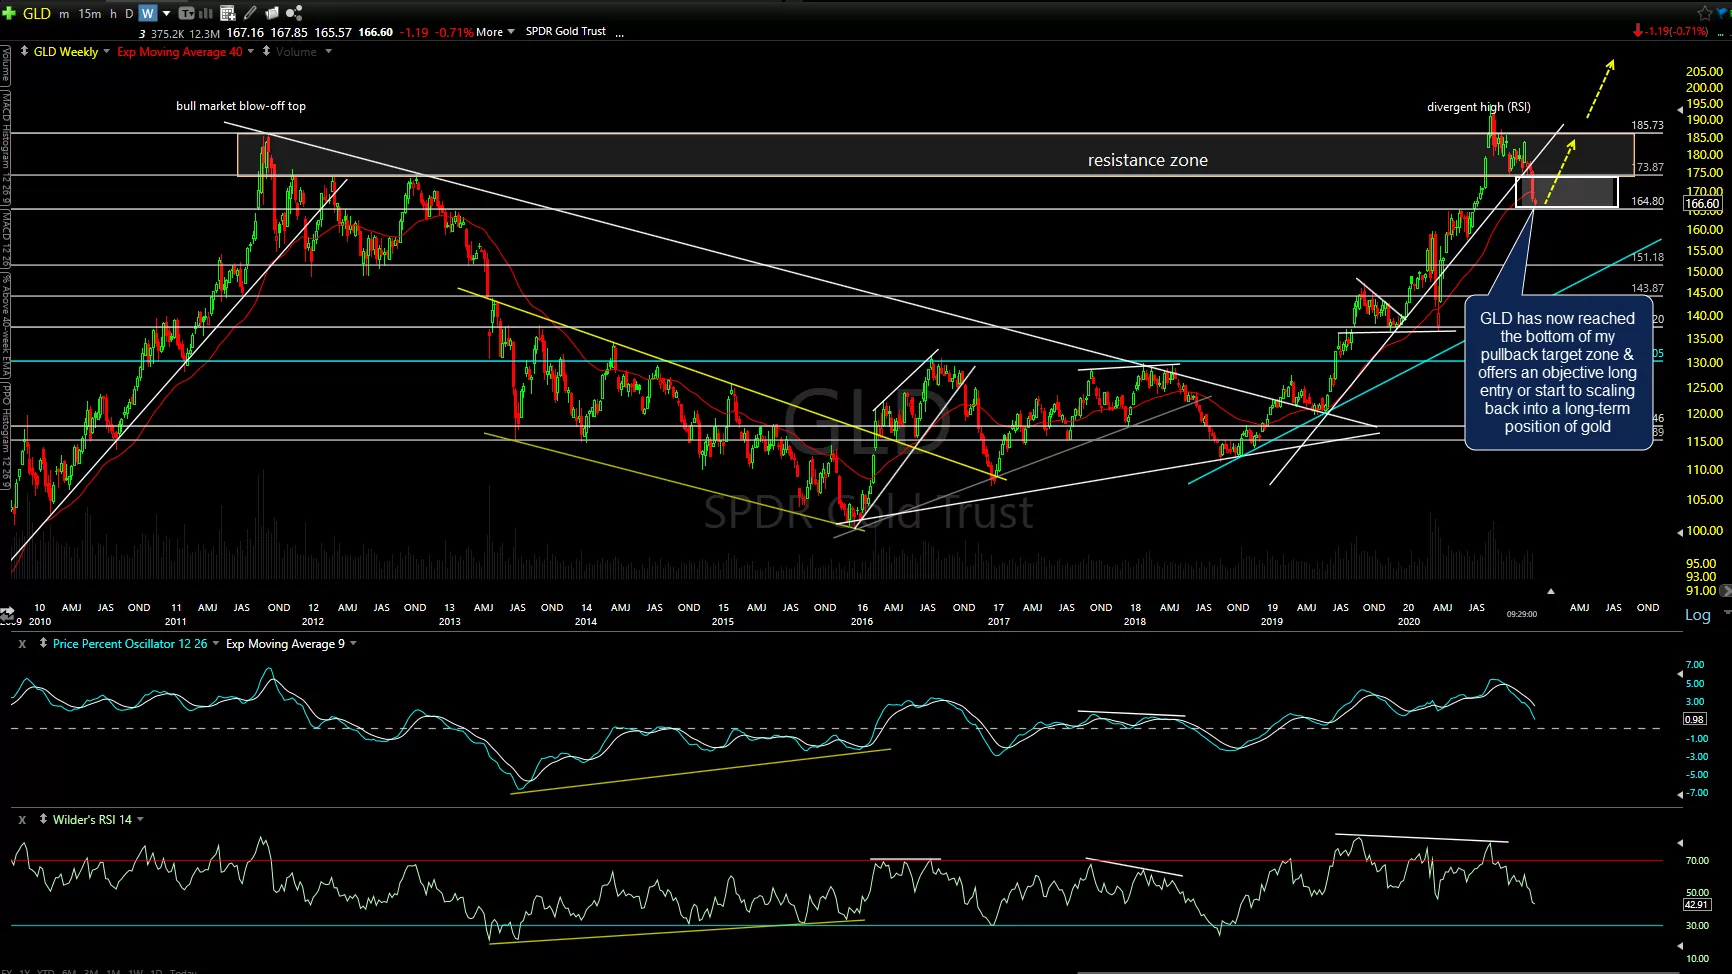
- GLD weekly Nov 30th
-
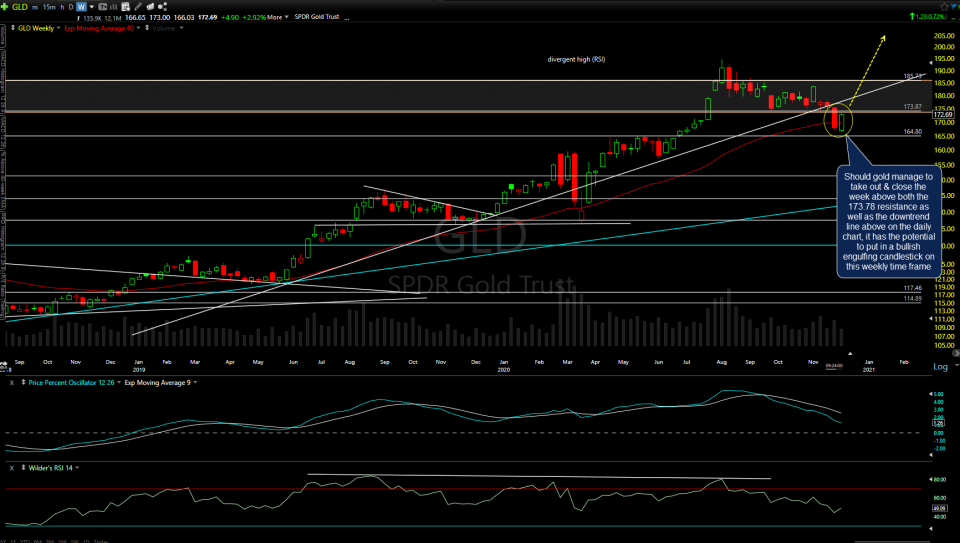
- GLD weekly Dec 3rd