
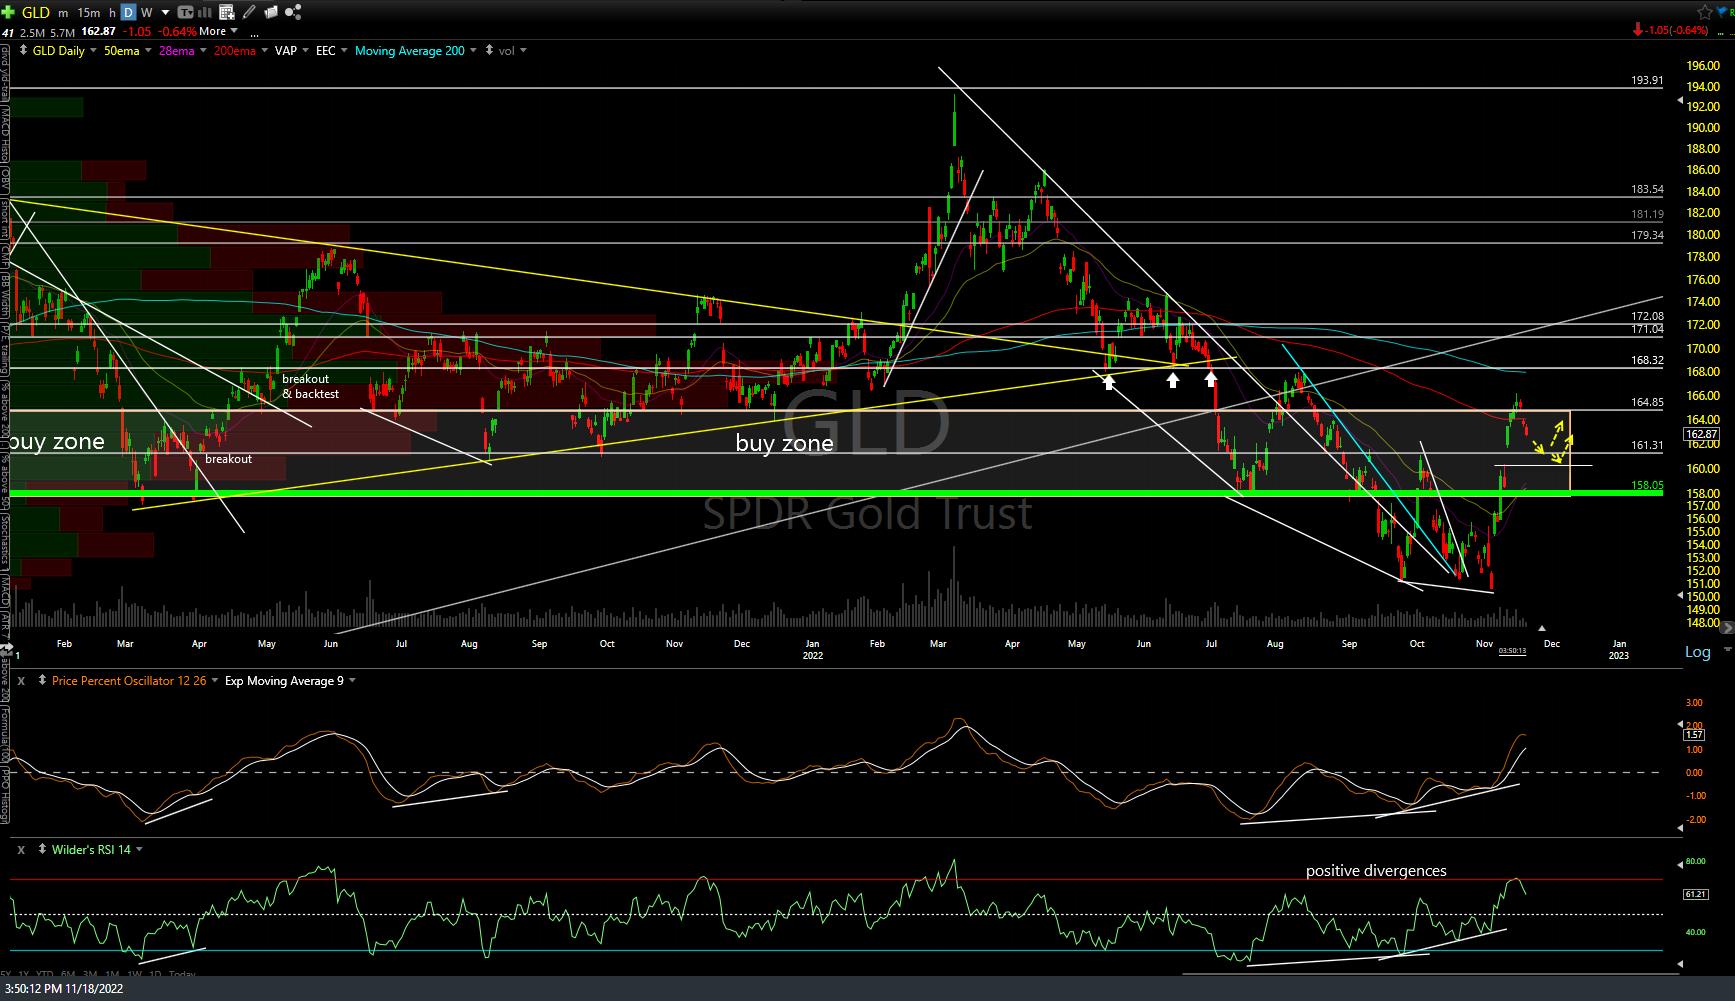
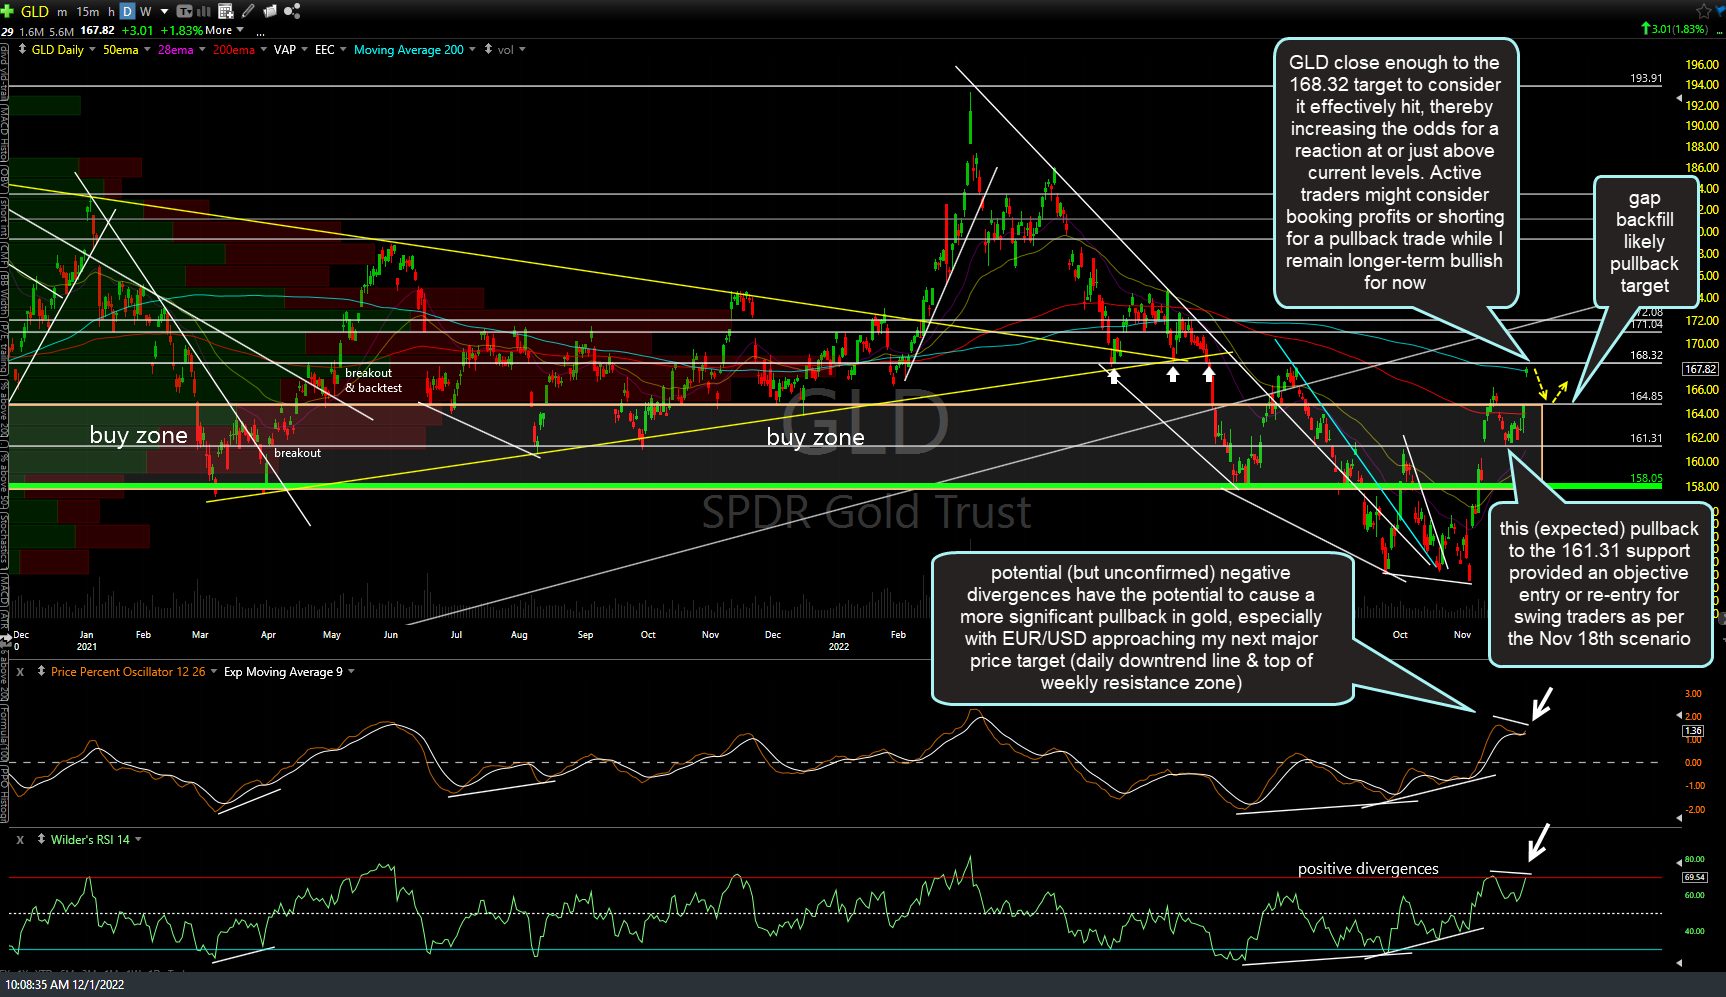
GLD (gold ETF) is close enough to my next price target of 168.32 to consider it effectively hit, thereby increasing the odds for a reaction at or just above current levels. Active traders might consider booking profits or shorting for a pullback trade while I remain longer-term bullish for now. Previous (Oct 2nd & Nov 18th) and updated daily charts below.

GLD daily Oct 2nd
GLD daily Nov 18th.png
GLD daily Dec 1st
The recent rallies in gold & silver were driven by both their own unique bullish technical postures & developments but also by the clearly bullish technicals on the Euro (which has a strong positive correlation to gold) and clearly bearish technicals on the US Dollar (negatively correlated to gold) with gold & silver rallying 11% & 29%, respectively, off their Sept lows, which (not coincidentally) coincided with the Sept bottom in EUR/USD & the subsequent breakout & rally above the minor downtrend up to the primary downtrend line as of today (my initial swing target, as per the previously posted EUR/USD daily chart from Sept 12th, below).

EUR-USD daily Sept 12th
EUR/USD has rallied into (or close enough to) the primary downtrend line with negative divergences on the daily time frame, with the odds for a tradeable pullback in the Euro, gold, & silver substantially increasing at this time.

EUR-USD daily Dec 1st
Additionally, EUR/USD has rallied to the top of my major long-term resistance zone with the weekly downtrend line not far above (i.e.- odds for a pullback in the Euro/rally in $USD increasing at this time).
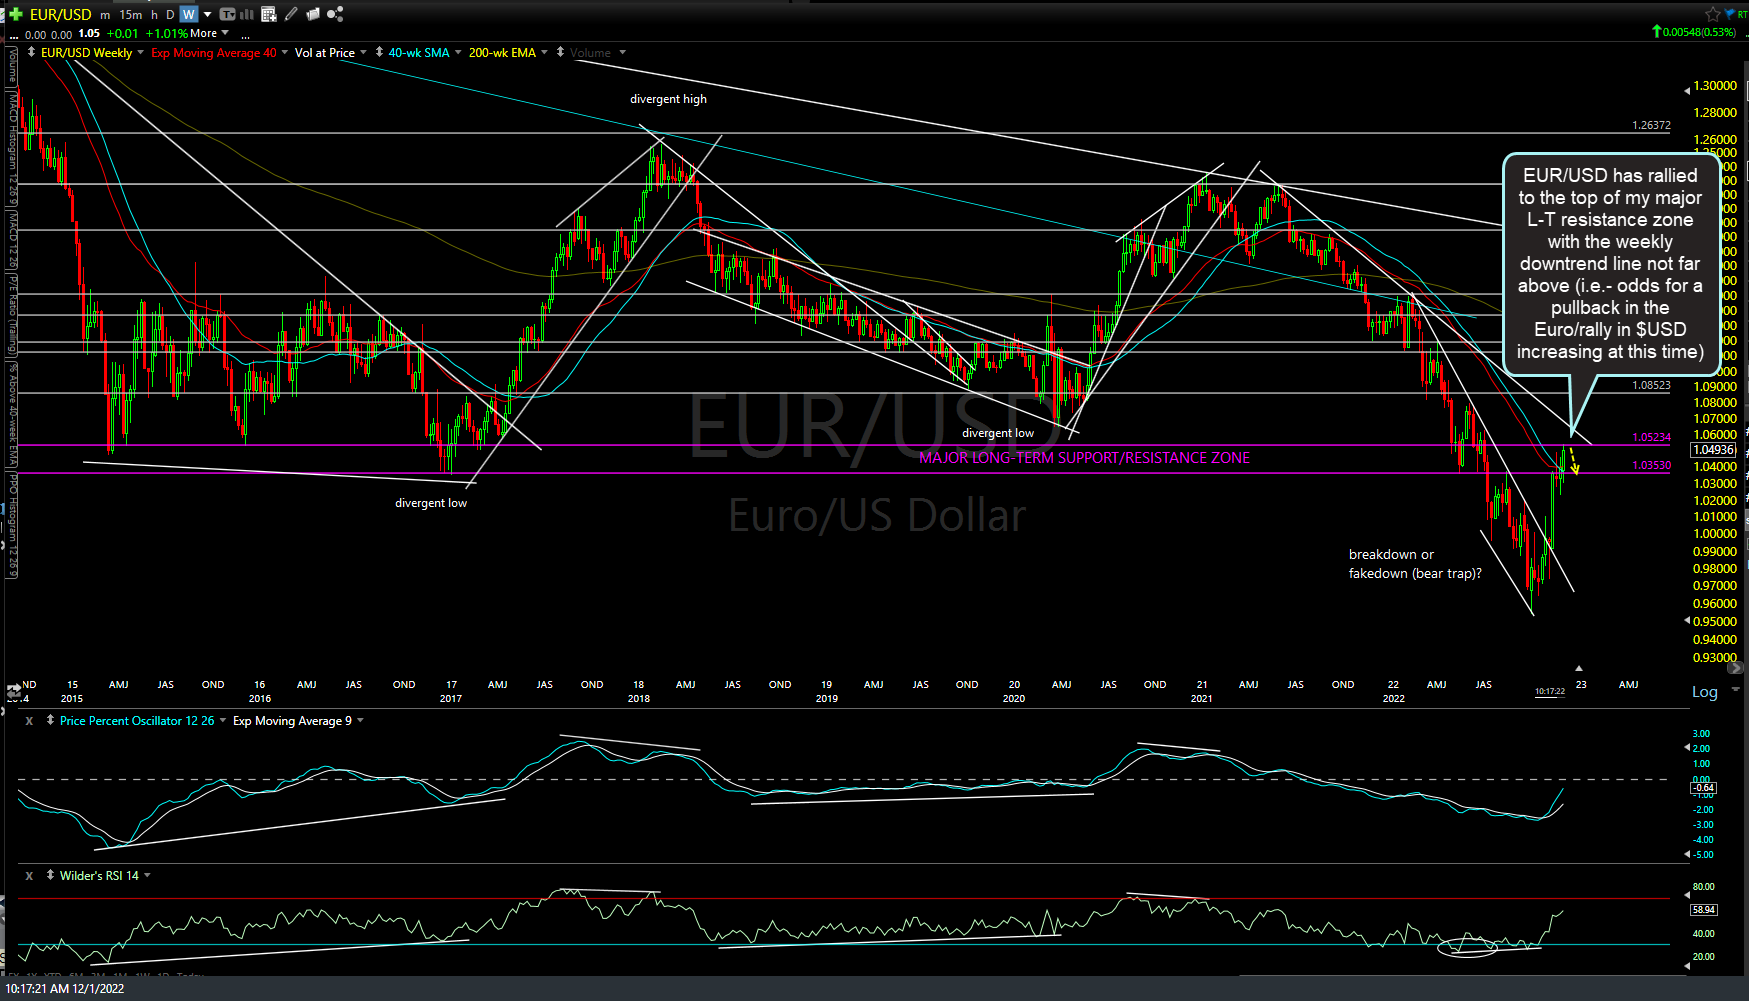
EUR-USD weeily Dec 1st