
While the daily charts of gold & silver aren’t looking so hot, /GC (gold futures) is once again testing the key 1492 support level on this 60-minute chart following a very brief & slight overshoot, again offering another objective long entry for active traders with stops somewhat below.

GC 60m Sept 30th
Likewise, there are also potential but unconfirmed bullish (positive) divergences still building on the 60-minute chart of /SI (silver futures) as it works its way down towards the 16.942 support with objective long entires to come on a break above this downtrend and/or just above the 16.942 support.
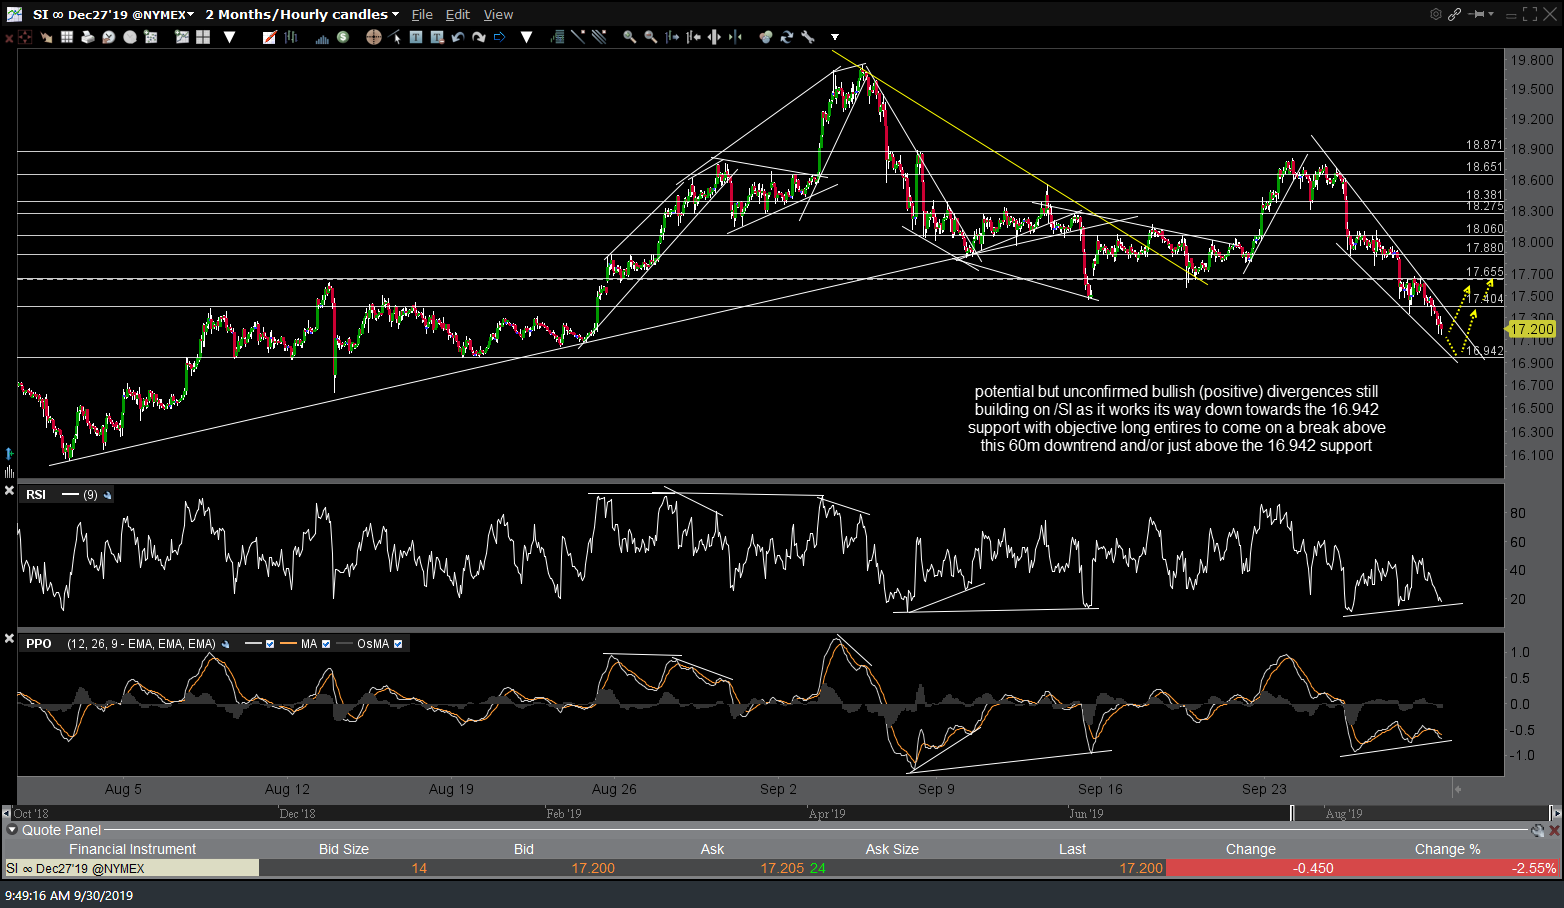
SI 60m Sept 30th
No change yet on the technical posture or key levels to watch on the major stock indices since Friday’s closing market wrap video. I’m still flat (no positions) the equity indexes in my active trading account since closing out that last bounce long around the close on Friday, awaiting the next objective entry for any possible active trades, long or short, as well as an impulsive break and solid daily close below the December 24th uptrend lines on the key stock, sectors & indexes highlighted last week.