
In the April 16th update on the GLD official trade idea, I had stated “…there are a few developments in the charts worth monitoring that could derail gold’s rally, at least in the near term, should they play out.” Those developments did play out with that ‘speed bump’ on the road to the final target being this 10-week sideways consolidation range which GLD recently broke above to resume the rally. April 16th chart followed by the updated daily chart below.
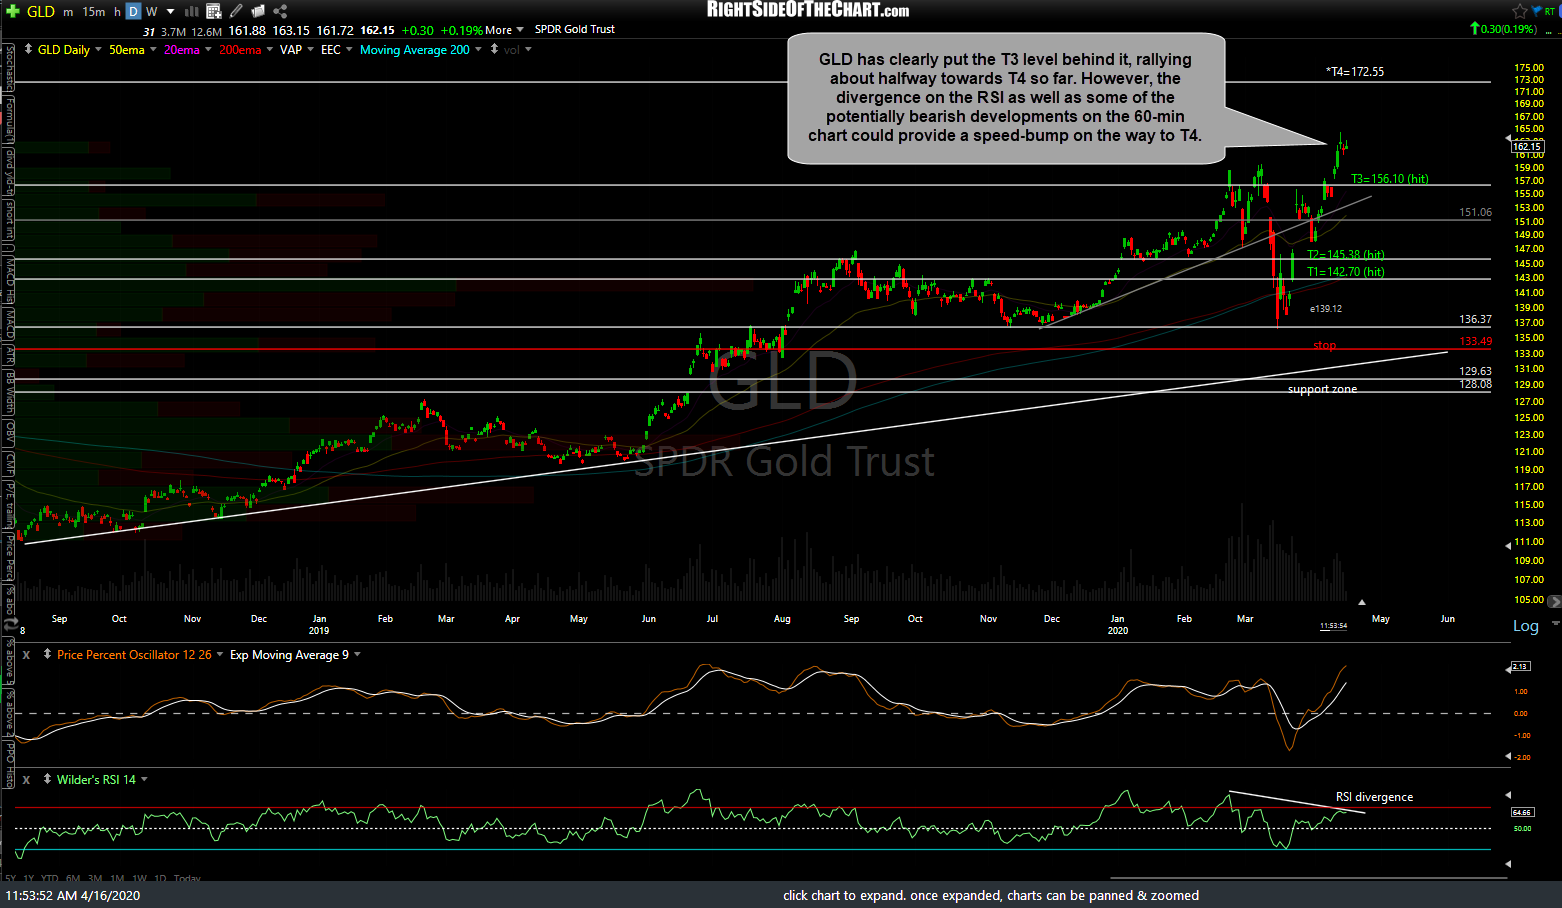
GLD daily April 16th
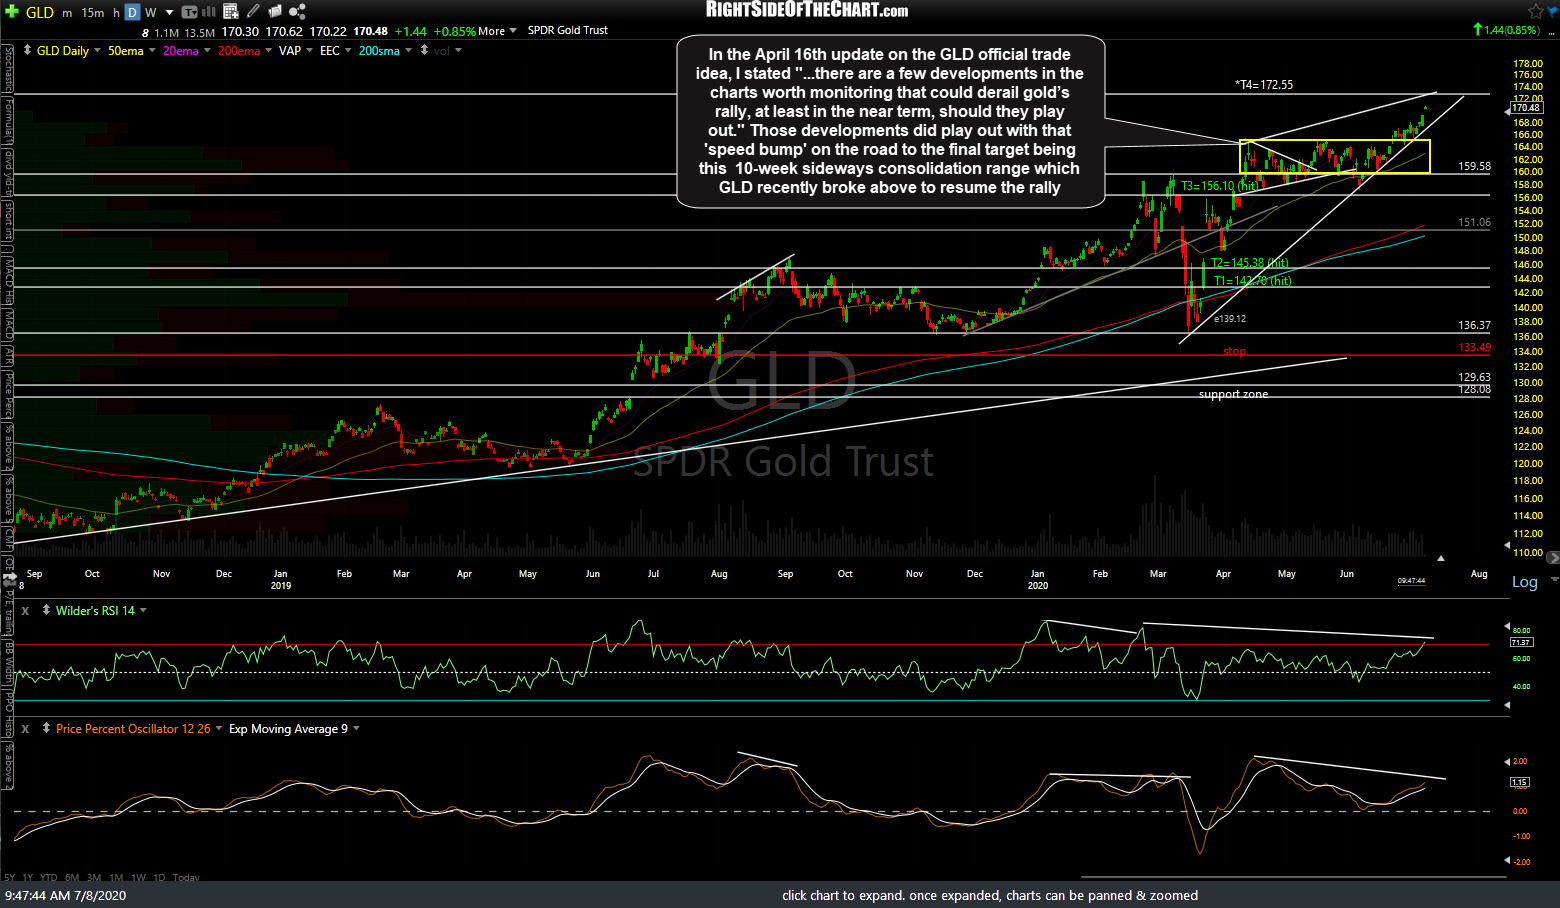
GLD daily July 8th
As gold remains solidly entrenched in a bull market, those divergences highlighted back then & since only played out for a correction more so in time than in price. Keep in mind that the divergences are still well intact for now & may yet still play out for a significant trend reversal at some point in the near future. However, with both GLD & /GC (gold futures) starting to move away from the nearly 3-month sideways consolidation range, it appears that the GLD Swing & Long-Term Trend trade has a good shot of reaching the final price before any meaningful reversal. T4 (172.55) remains the final target where the trade will be considered closed out, if hit. Longer-term investors & trend traders looking for more upside on gold could consider raising or trailing stops & letting some or all of their position ride.
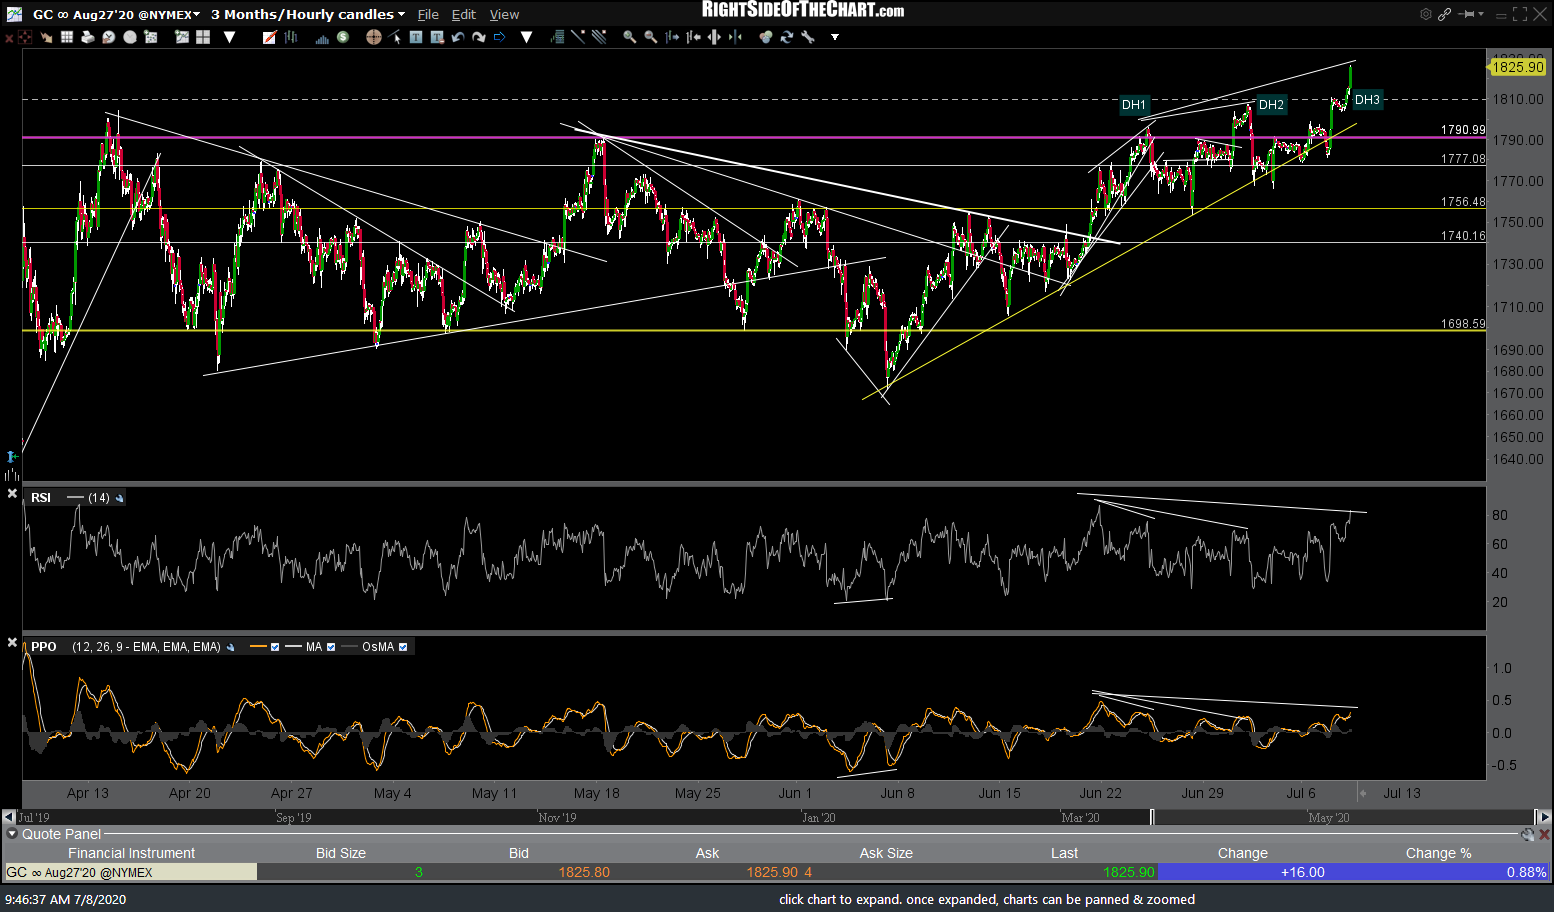
GC 60m July 8th
Zooming down to the 60-minute chart of /GC above, after a few brief whipsaws above the key 1791 resistance level (top of the multi-month trading range), gold futures continue to stairstep higher and appear to have cleared the top of the trading range by enough to say that the breakout is likely to stick, although the divergences are also still intact on that 60-minute time frame for now as well as the daily & weekly charts.