
The GLD (gold ETF) Active Swing Trade + Long-term Trade idea continues to chug along since putting the T3 level in the rearview mirror, rallying about halfway to the fourth & current final target so far. However, there are a few developments in the charts worth monitoring that could derail gold’s rally, at least in the near term, should they play out.
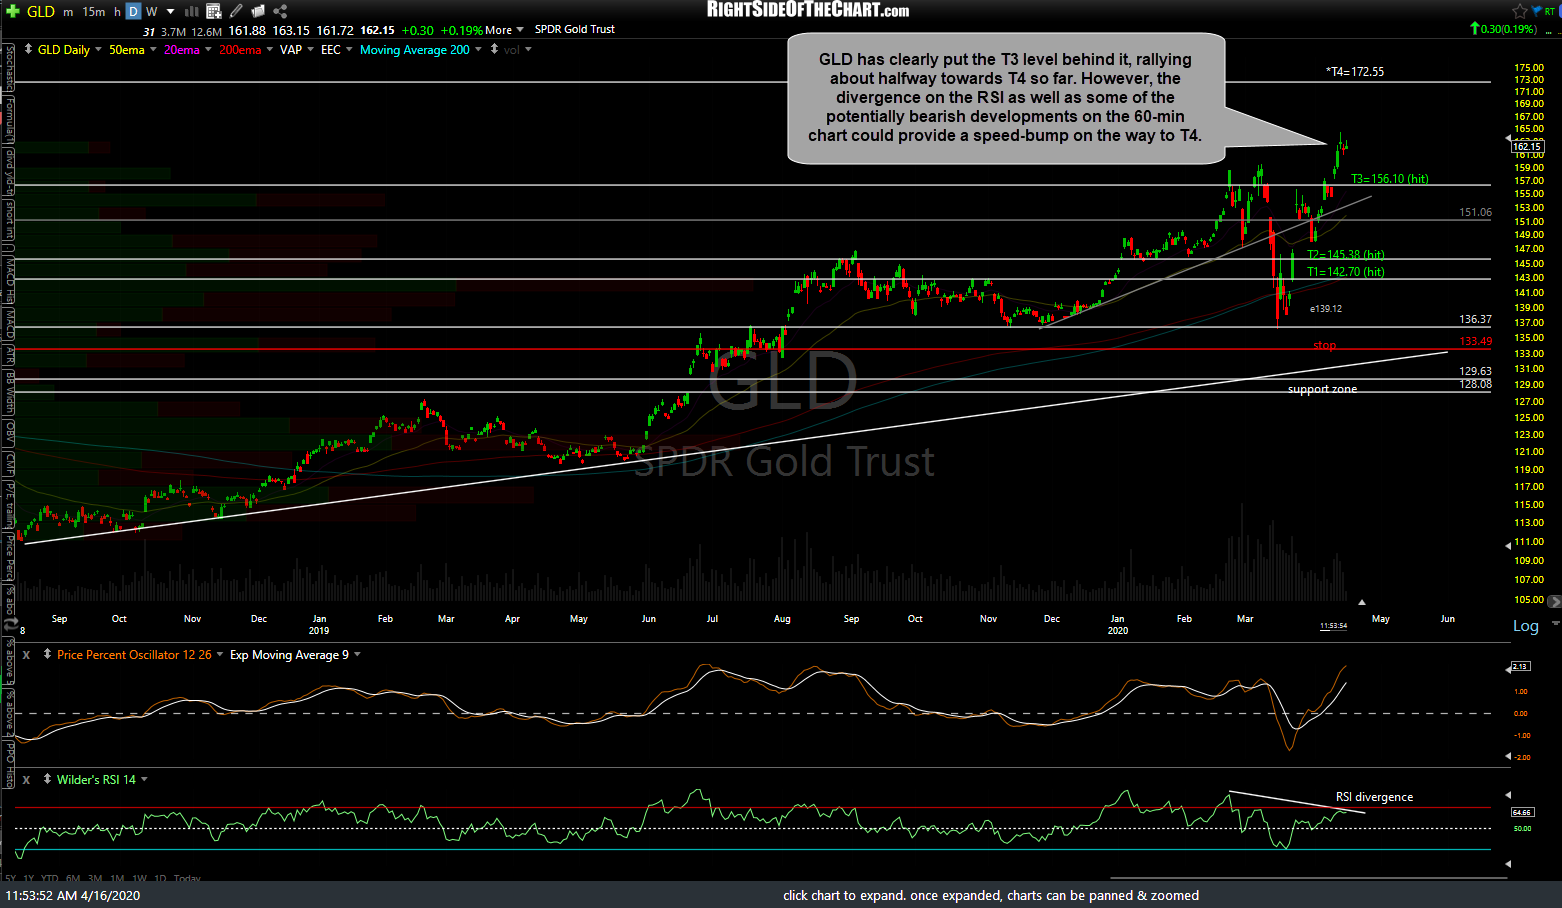
GLD daily April 16th
/GC (gold futures) breakdown & backtest of the 60-minute bearish rising wedge pattern with potential sell signals to come on a break below this minor TL and then a solid break & 60m close below the 1728ish support & larger uptrend line while a recovery back above the primary uptrend line would be bullish, putting a bear trap/false breakdown scenario in play. Whether or not the bearish or bullish near-term scenarios play out will most likely depend on whether or not the recent rally in the stock market continues or ends soon.
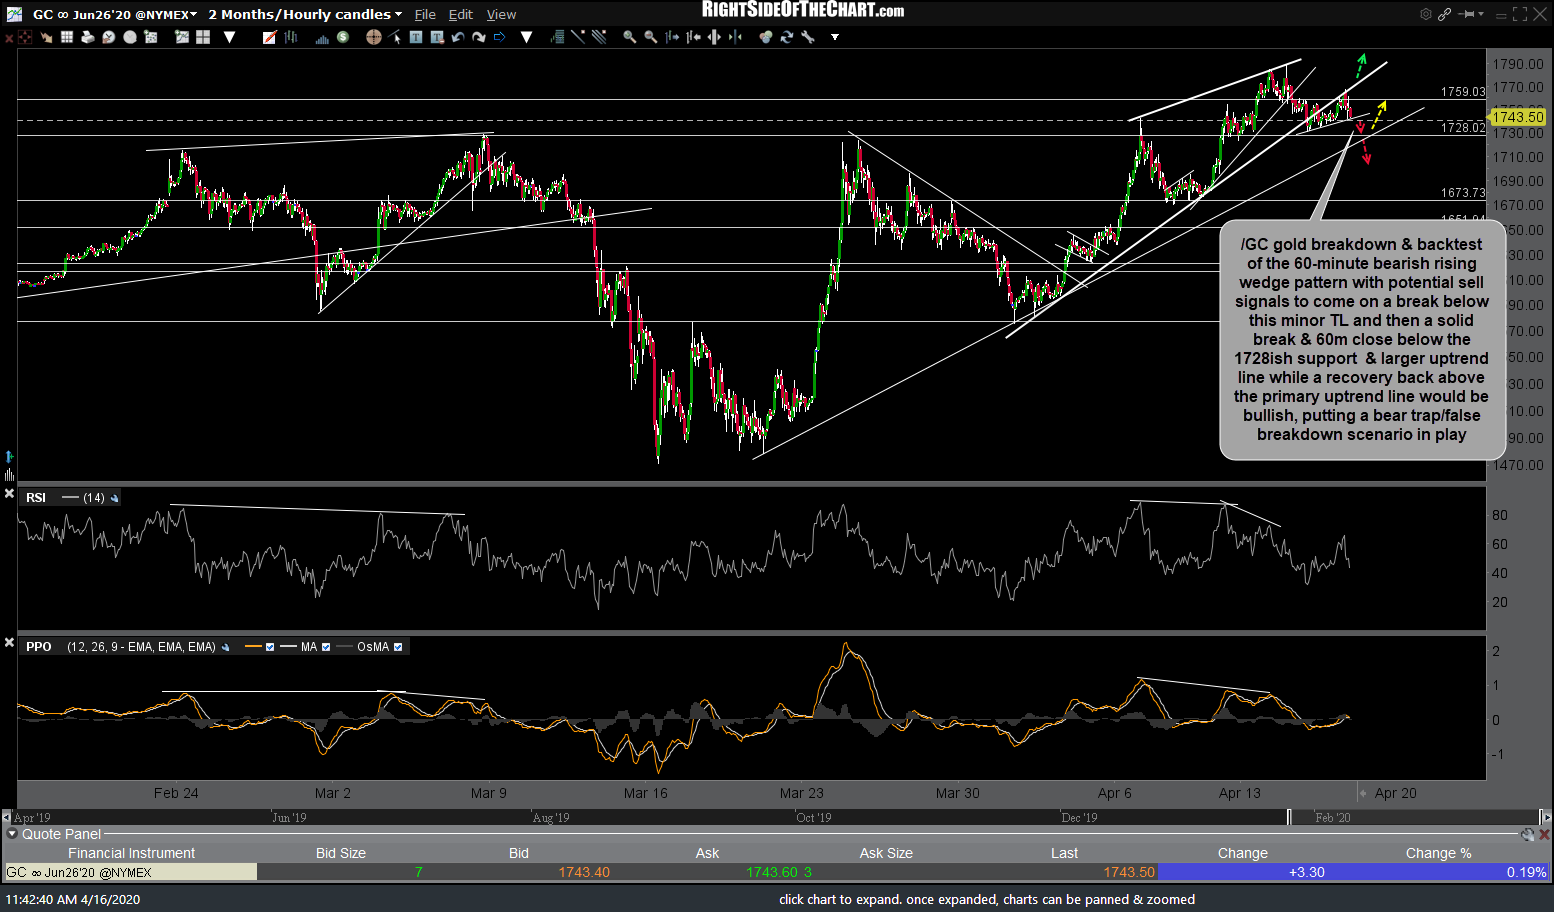
GC daily April 16th
The near-term direction on gold will also likely depend on which way /DX (US Dollar) breaks from here with some nearby support & resistance levels to watch on this 60-minute chart below.
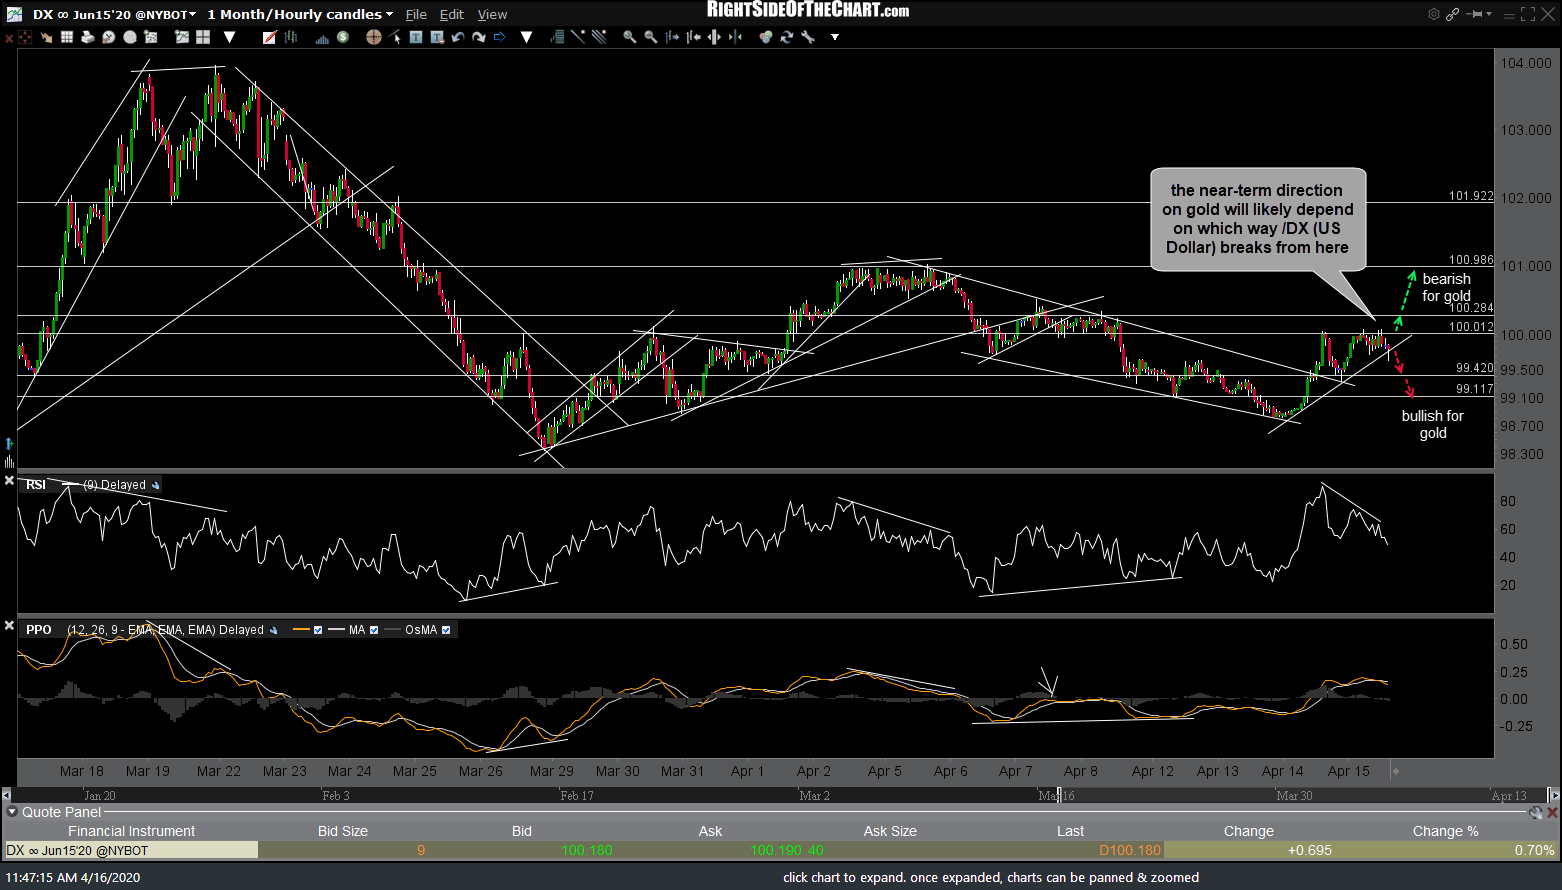
DX 60m April 16th
Bottom line: In a vacuum, looking only at the recent bearish developments on the 60-minute chart of /GC, (i.e.- a breakdown below the smaller rising wedge followed by a break & backtest of the larger, more significant uptrend line following the divergent high/negative divergences), I would have to say that I would favor a considerable correction coming in gold & might be looking to close out my longs & short it here & adding to a short on a solid break below 1728.
However, taking into account the fact that gold is solidly entrenched in a larger bull market coupled with the fact that the stock indexes are still testing key resistance with negative divergences still very much intact on the 60-minute charts, I suspect that gold will shrug off the current bearish technical posture & recent developments on the 60-minute charts soon, especially if the divergences on the equity indices start to play out for the next wave of selling soon (as I also suspect).
Of course, I may be wrong & as such, I want to pass along these recent developments & nearby levels to watch for those interested. Even if these 60-minute bearish developments do play out for a correction in gold, any pullback would most likely be contained around the 1673ish support on /GC and 156-153ish level on GLD as it would take a much larger drop to put even the slightest dent in the longer-term bullish trend in gold.