
So far, GDX (Gold Miners etf) found support at the S1 level (18.80) previously highlighted on both the 15 & 60 minute charts and has moved higher since. A slight modification has been made to the lower trendline on the symmetrical triangle pattern on this updated 60-minute GDX chart in order to adjust for the recent price action. Although a lot of focus has been on the very near-term direction of GDX recently via the 15-minute charts, the intermediate to longer-term outlook for GDX could hinge on the direction in which prices breakout from this symmetrical triangle pattern.
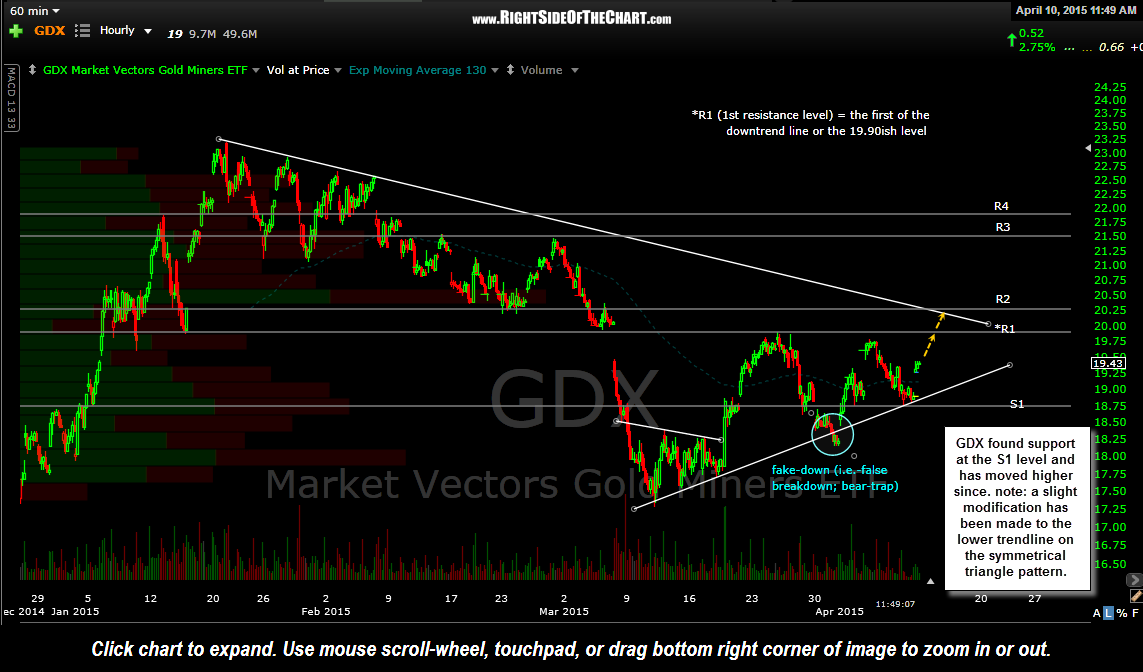
GDX 60 minute April 10th
Regarding the $USD (US Dollar), the bullish fake-out (false upside breakout) scenario could still be in play should UUP reverse here around this horizontal resistance level (26.20ish level). It is worth noting that gold & the mining stocks are mounting a decent rally today despite a continued rise in the dollar. Typically, when these disconnects between the usual inverse correlation between gold/GDX and the $USD occur, a reversion to the mean often follows. In other words, although today’s rally in gold & gold stocks could just be a one-day aberration, should this disconnect continue, one or the other is likely to play a quick game of catch-up (i.e.- either the $USD corrects or GLD/GDX moves lower).
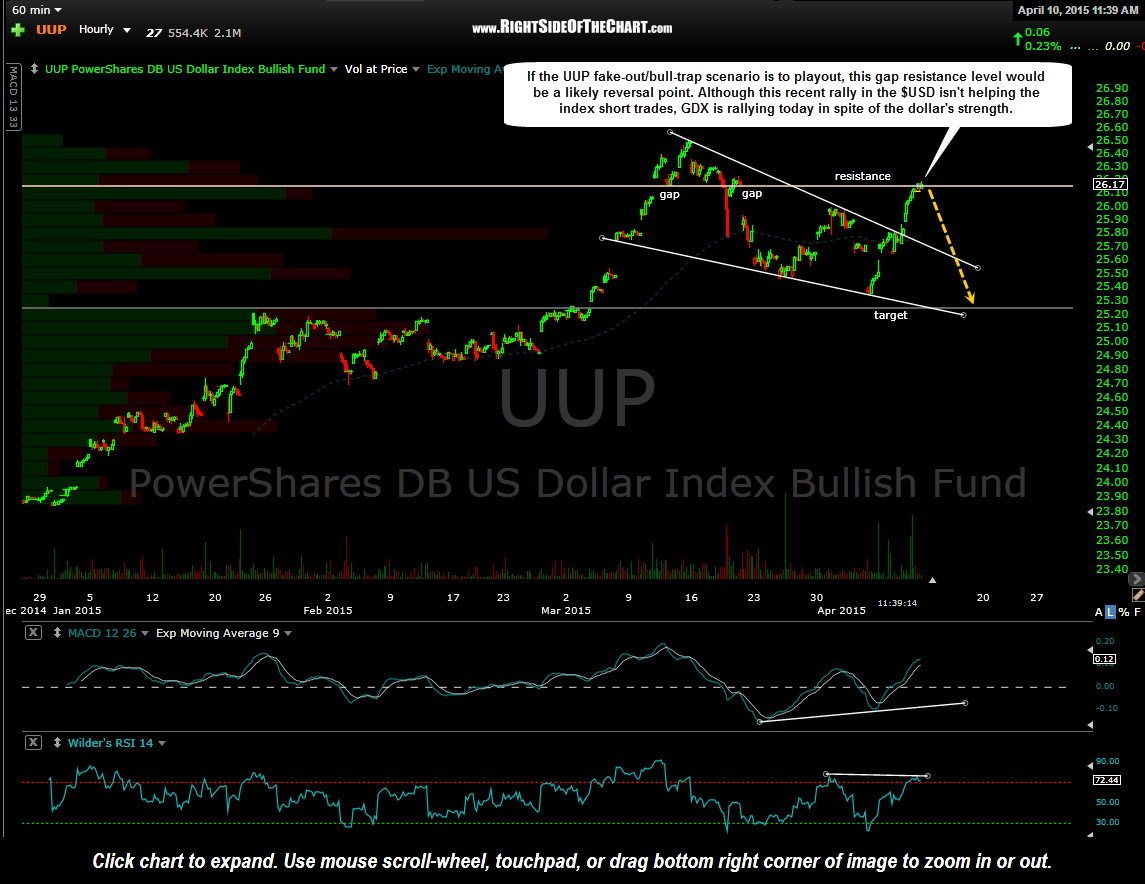
UUP 60 minute April 10th
My near-term read on the dollar is still not very clear and although I remain bullish and long gold stocks, price action in the miners is likely to continue to be choppy until a clear resolution of the symmetrical triangle pattern. I remain cautiously bullish both gold & the precious metal mining sector at this time and favor an upside resolution of the GDX 60-minute triangle pattern. Of course, that opinion & my position is subject to change as the charts do.
As I often state, where gold prices go, the miners will ultimately follow. Despite one’s near-term outlook (bullish or bearish) for gold, the fact that GLD is clearly in a short to intermediate-term uptrend is indisputable. An uptrend is simply defined as prices making a series of higher highs and higher lows, which has been the case in GLD since the mid-March lows. Only a break below this reaction low around the 113.44 area would do some technical damage to the current uptrend.
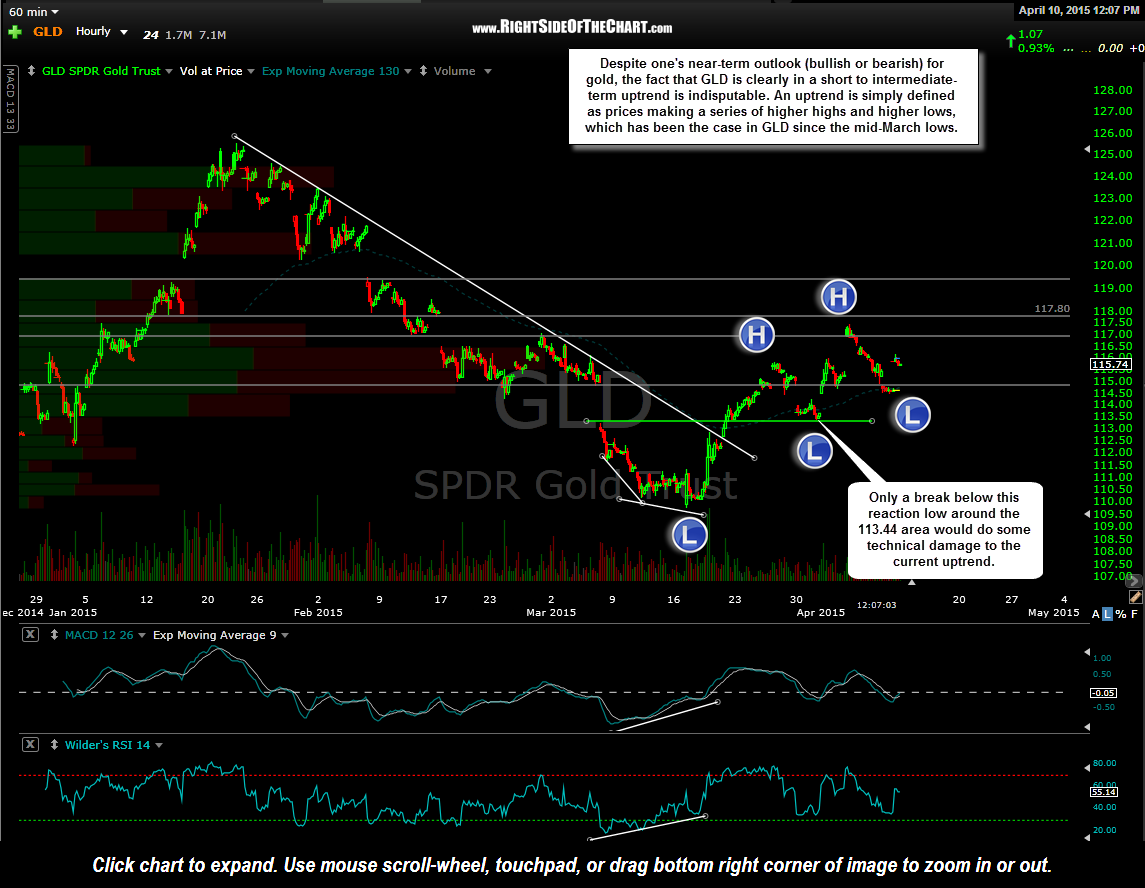
GLD 60 minute April 10th