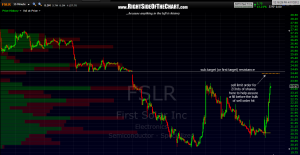
i normally don’t post my day-trades as the majority of traders, at least on this site, are swing traders (1+ day time horizon) but every now & then i might actively post how i’m trading a specific trade for educational purposes. keep in mind that a momentum trade like FSLR can turn on a dime at anytime so best to trail up your stops to protect profits and at the very least, move them up to entry once the trade has moved up this much. i’ll plan to do a post in the near-future on how to adjust your position size for day-trade but for now, here’s a 15 min chart zooming in on that sub-target that i added to the last 30 min chart.
as you can see, that horizontal resistance level is pretty clearly defined towards the left of the chart. therefore, i would expect at least a reaction (pause or pullback) off that level and as such, there will likely be a cluster of sell order parked up there or entered as market orders at the price approaches that level. sometimes prices will stop just shy of an obvious resistance level and quickly reverse and as soon as the momo (momentum) traders see this, they quick rush to close out their positions, which further exacerbates the selling. to avoid missing an idea exit near my target, i will usually set my order just below the actual target level using a sell limit order (or buy-to-cover limit on a short trade). the 15 min chart below shows where i have a sell limit order for about 2/3rd of my shares and if it fills, i plan to continue moving the stops up on the remaining shares and take them home for a potential swing trade up to one or more additional targets.
note: as i type, FSLR is about even with that previous reaction high at 23.88 so it may find some resistance there and should continue higher if it can take that level out. again, the rips and dips come fast and out of nowhere in this HFT machine driven market so be careful and don’t get married to any one position.


