
SPY 2 min pre-market Oct 2nd
When I booted up this morning, the markets were poised for a modest gap higher at the open. Turned my back to check emails & when I looked back at my pre-market charts mosaic screen, I could see that the equity markets must not have been too excited about the employment numbers that were released at 8:30am ET.
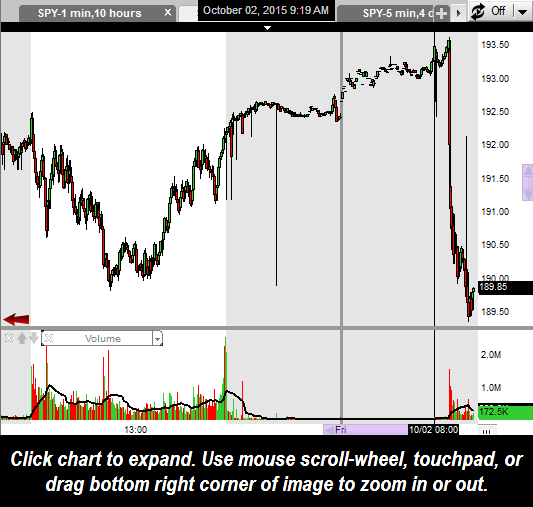
As ugly as that waterfall drop appears on this 2-minute period chart (shaded areas indicate trades outside regular trading hours, i.e.- post & pre-market trades), so far, the post-employment data sell-off has been an insignificant technical event. The same ‘most probable’ scenarios that I have been discussing recently are still in play, listed in the descending order of likelihood:
- The broad markets reversed just shy of the Aug 24th lows where a large percentage of traders & investors were looking to step in to buy (and always striving to not give the majority what they want, Mr. Market decided to reverse just shy of those levels, denying the optimal entry that so many were looking for).
- The markets may go on to undercut the Aug 24th lows in order to run the stops on the longs that do (or already have) step in to buy & suck in some new shorts before reversing & mounting a multi-week/month rally.
- The bearish pennant pattern scenario on the daily chart is in play with the last couple of days just a brief relief rally/pause before the impulsive selling resumes, taking the $SPX down to the 1790/1800ish area.
Today should be an interesting day. I remain cautiously bullish for now but don’t plan to do much today unless the market shows me something new. Regarding the TNA Active Long trade, I’ll leave the official stops as a move below Tuesday’s low in IWM but personally, I’m holding my starter position until/unless the leading indices, $SPX & $NDX, break below their Aug 24th lows and I don’t see anything in the charts to indicate that the break will be more than just the temporary flush-out move discussed earlier.