
As mentioned early today, I am near-term bullish on most fixed income classes (municipal bonds, treasuries & investment grade corporates) but not so much on high-yield (junk) bonds, which are historically more closely correlated with equity prices than interest rates (most bond classes have a strong inverse correlation with interest rates).
-

- $TNX daily chart from 8/26/13
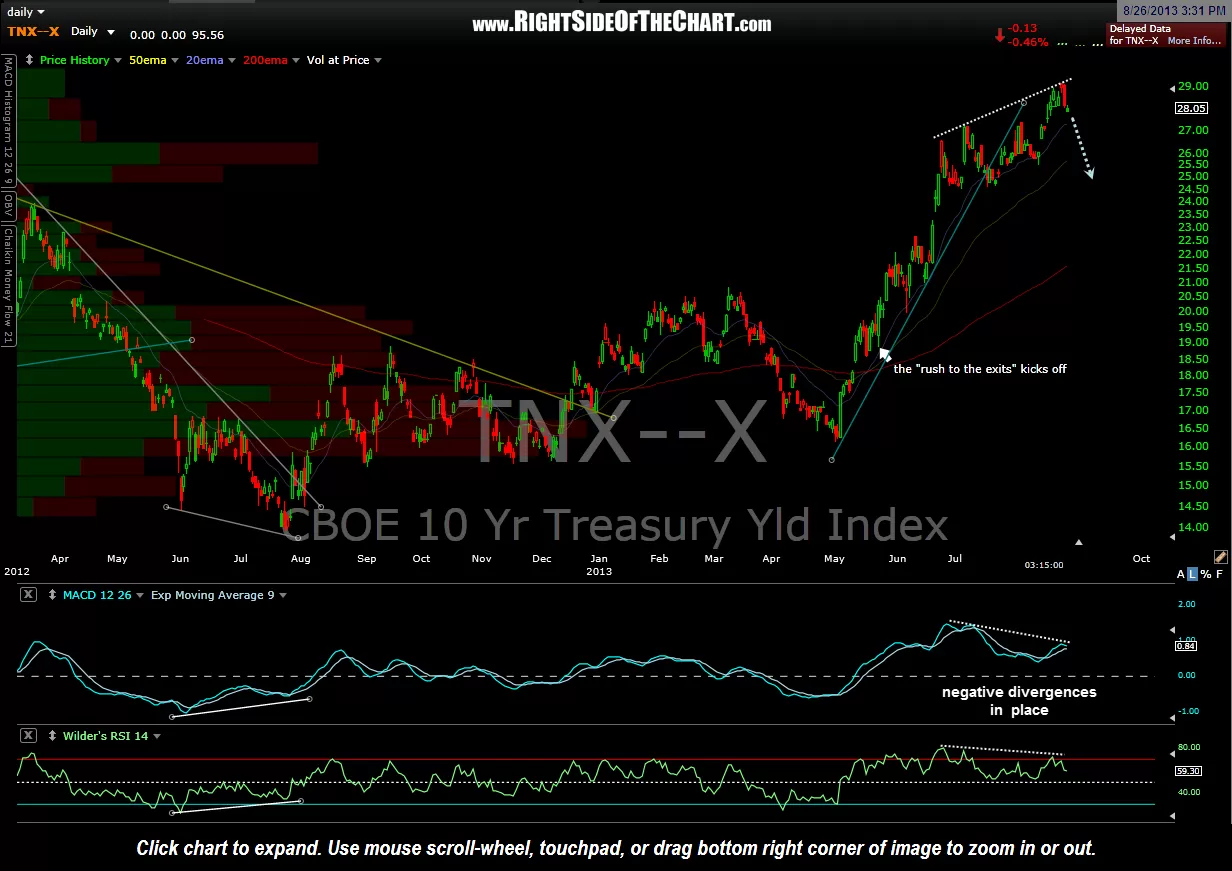
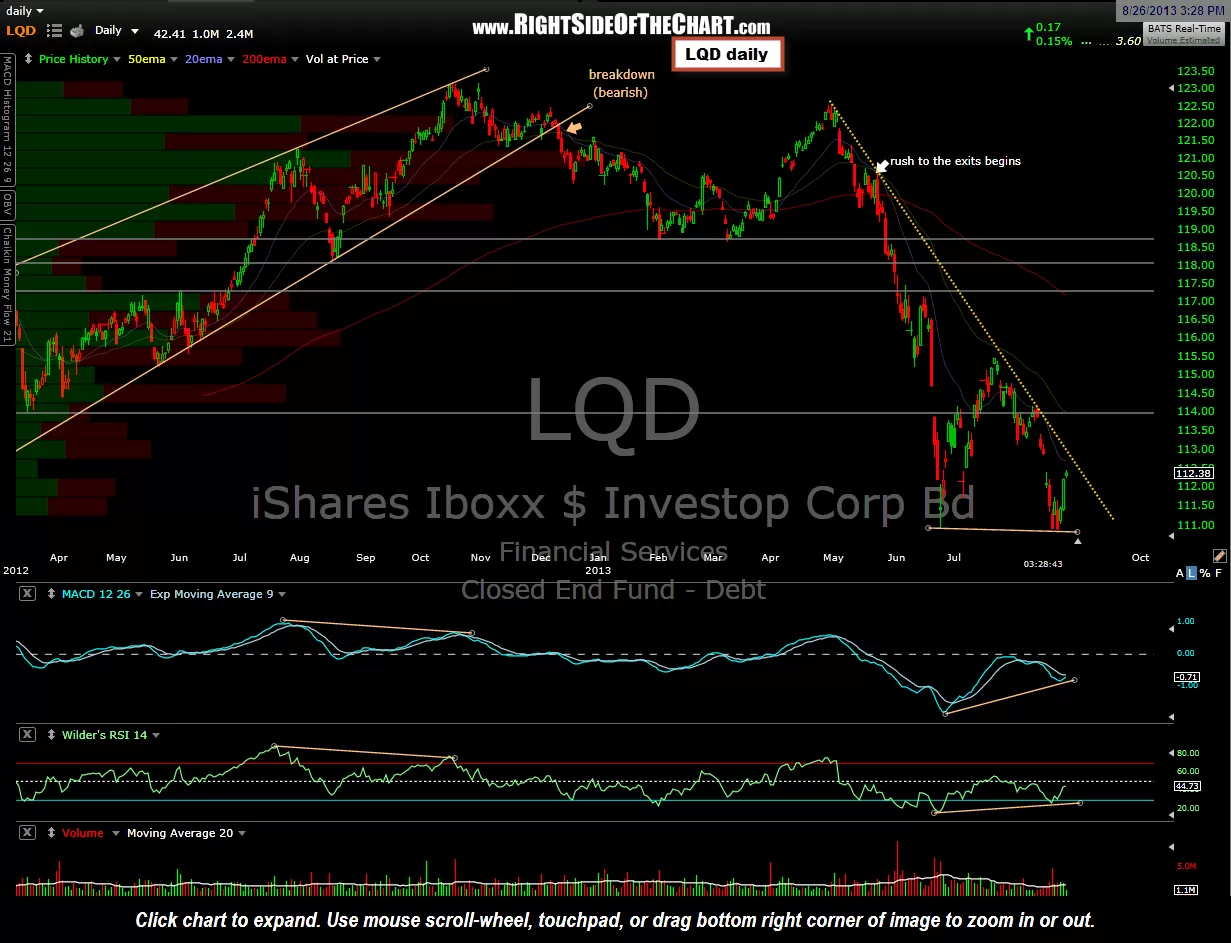
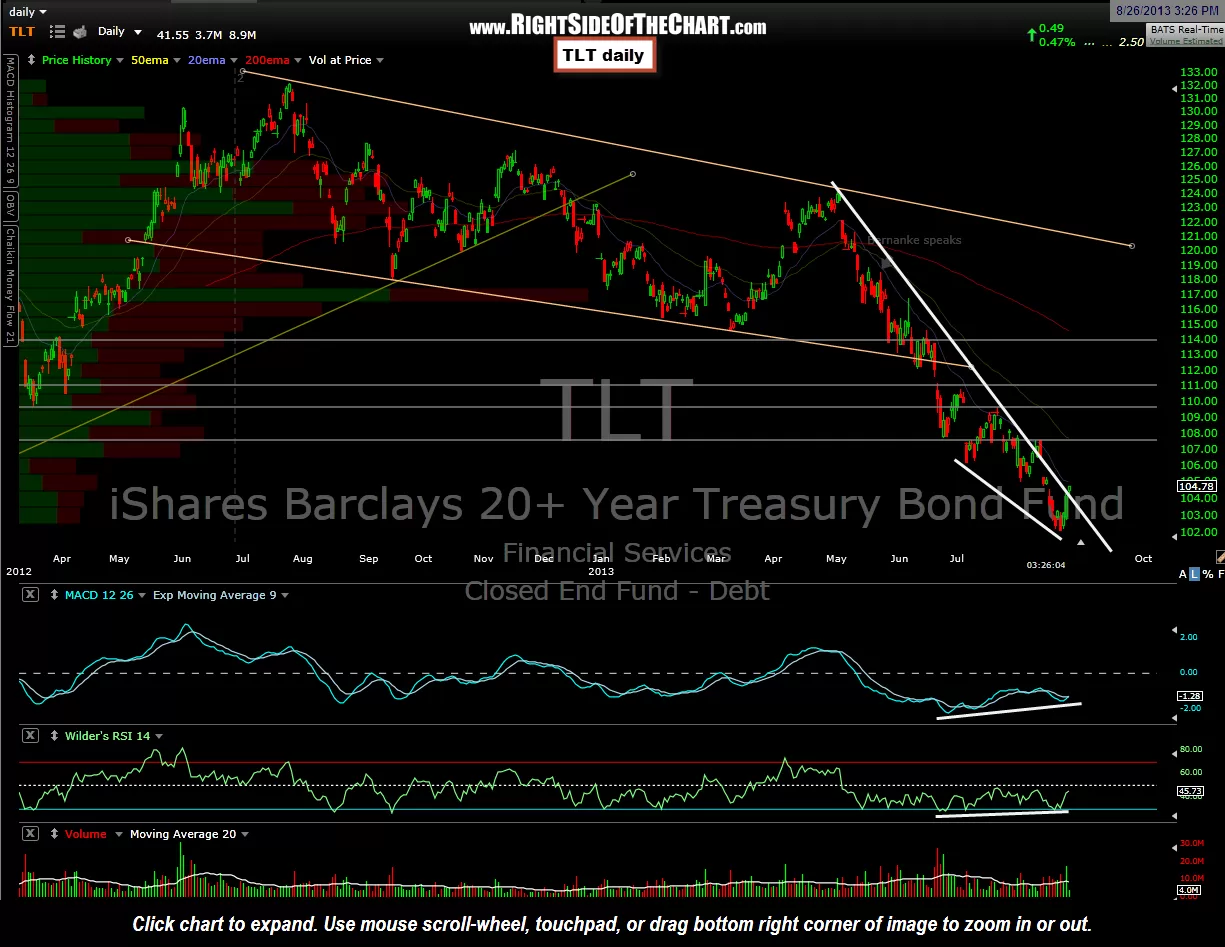
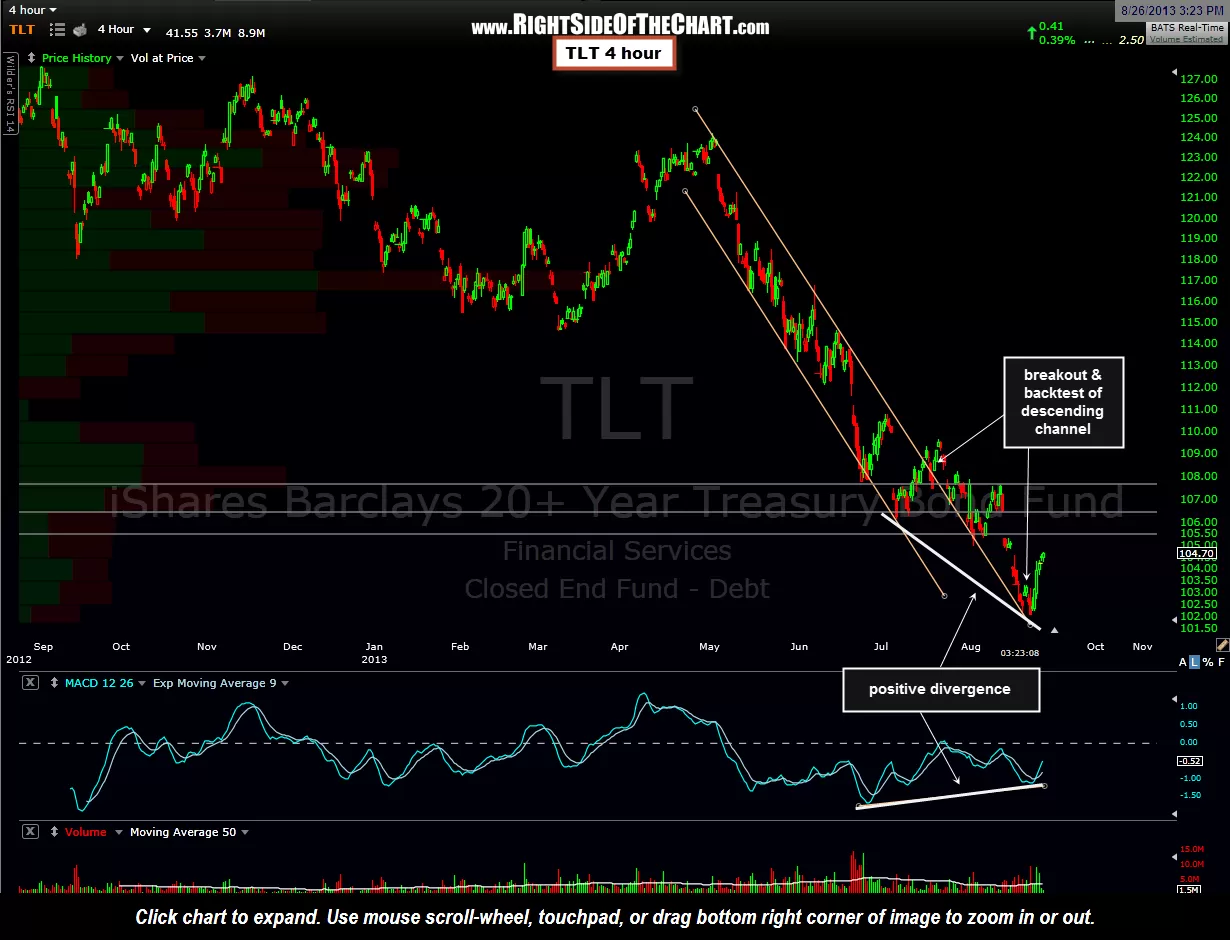
Here’s a quick snapshot of treasuries via the TLT (20+ year treasury etf, which of course shows prices) as well as the $TNX (10 year treasury yield index… i.e.- the interest rate of the 10 yr), followed by the LQD (Investment Grade Corporate Bond etf). The first chart is the daily frame of TLT highlighting what appears to be a bullish falling wedge pattern. That chart is followed by a 4 hour chart showing a breakout and low-level backtest of the descending channel that was posted a few weeks back with some 60 minute charts. The TLT charts are followed by the $TNX daily & LQD daily charts. Remember, $TNX looks bearish because it shows the 10 year treasury rates, not prices (rates down = prices up).