
Today’s release of the weekly AAII Sentiment Survey shows the third consecutive extreme bullish reading with a 26.5% spread on the Bull-Bear Spread. In updating this chart in real time following the extreme readings over the last couple of weeks, I am pointing out each extreme (18% or higher) reading as they occur. However, keep in mind that as discussed in the original post on this buy/sell indicator: “When I come across a cluster of consecutive or nearly consecutive extreme readings, I place the arrow on the last extreme reading. Although every extreme reading did not mark a major inflection point in the market, every major inflection point WAS marked (+/-) by one of the readings and those that didn’t, typically marked at least a tradable counter-trend correction.” Therefore, the “pin” or arrow, is now moved to today’s date as far as the signal goes. If the bull-bear spread contracts back below 18% next week, the sell signal is confirmed and the odds for a correction will then rise. If we get another 18%+ reading next week, the pin moves forward again. 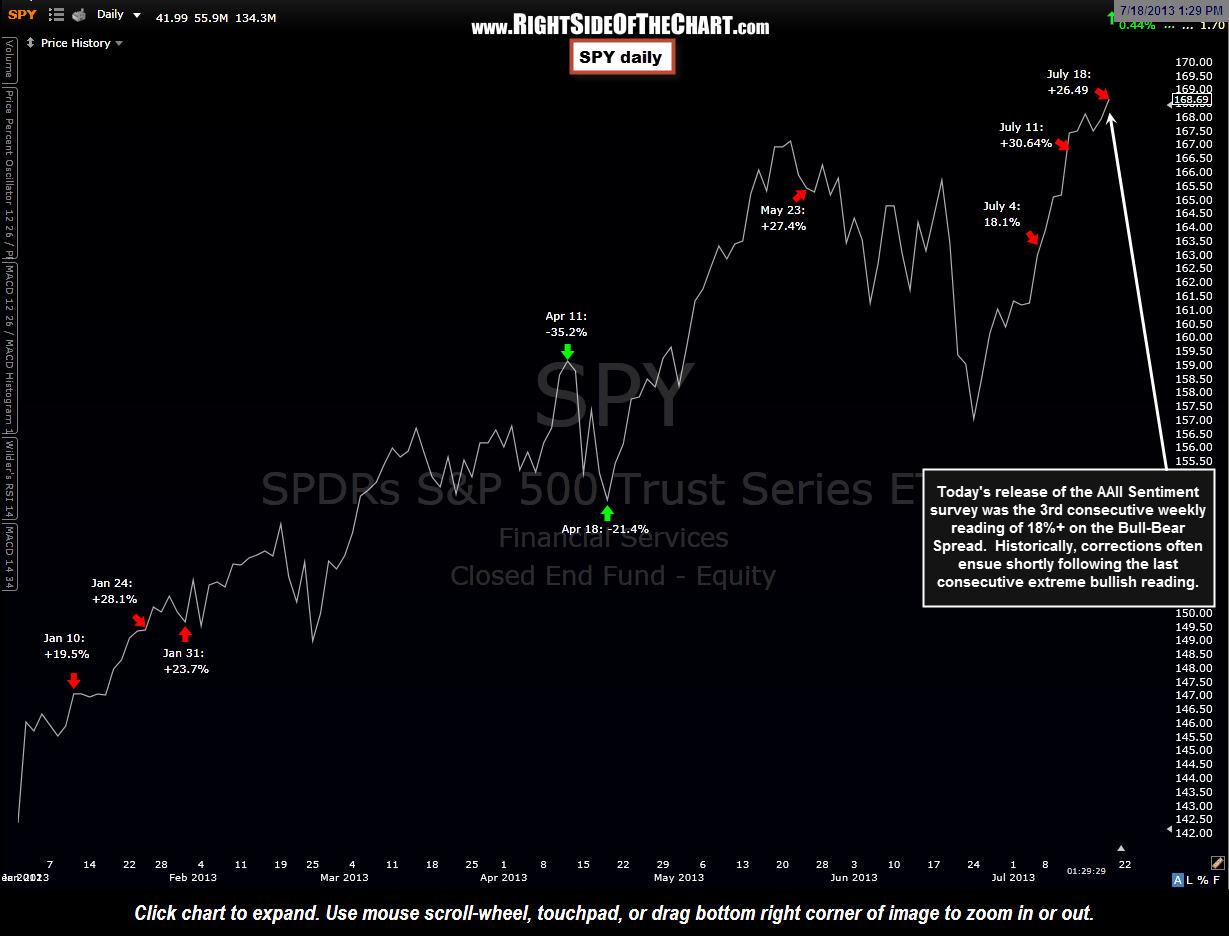 This updated daily chart from the beginning of the year shows all +/- 18% readings. As shown on the spreadsheets posted in that original chart, extreme bullish or bearish reading can persist for several weeks and sometimes even a month or more before abating. It is typically shortly after the readings fall back below the extreme levels before a rally or correction begins. It bears repeating that because of this, using these extreme sentiment readings and/or clusters is not an exact timing indicator, merely one of many tools to use in conjunction with other technical indicators and analysis.
Bottom line: According to all trend indicators from the 15-minute charts (following the recent whipsaw from sell back to buy), are bullish. This AAII Sentiment Extreme indicator and a couple other things that I’m watching are red flags that tell me to be very selective on establishing new long positions here. Ditto for shorting as only the most attractive patterns with the best risk to reward profiles should be considered. One of the most important attributes in trading is knowing when to actively engage the market and more importantly, when not to.