
/E7 (Euro futures) reversed just off the top of my T3 zone with the positive divergences intact & a cluster of resistance levels just overhead which are potential end-points for what is likely a counter-trend rally with more downside to come. First 60-minute chart calling for a correction in the Euro posted back on December 5th, one day before the Euro peaked & correction started followed by the updated daily chart below.
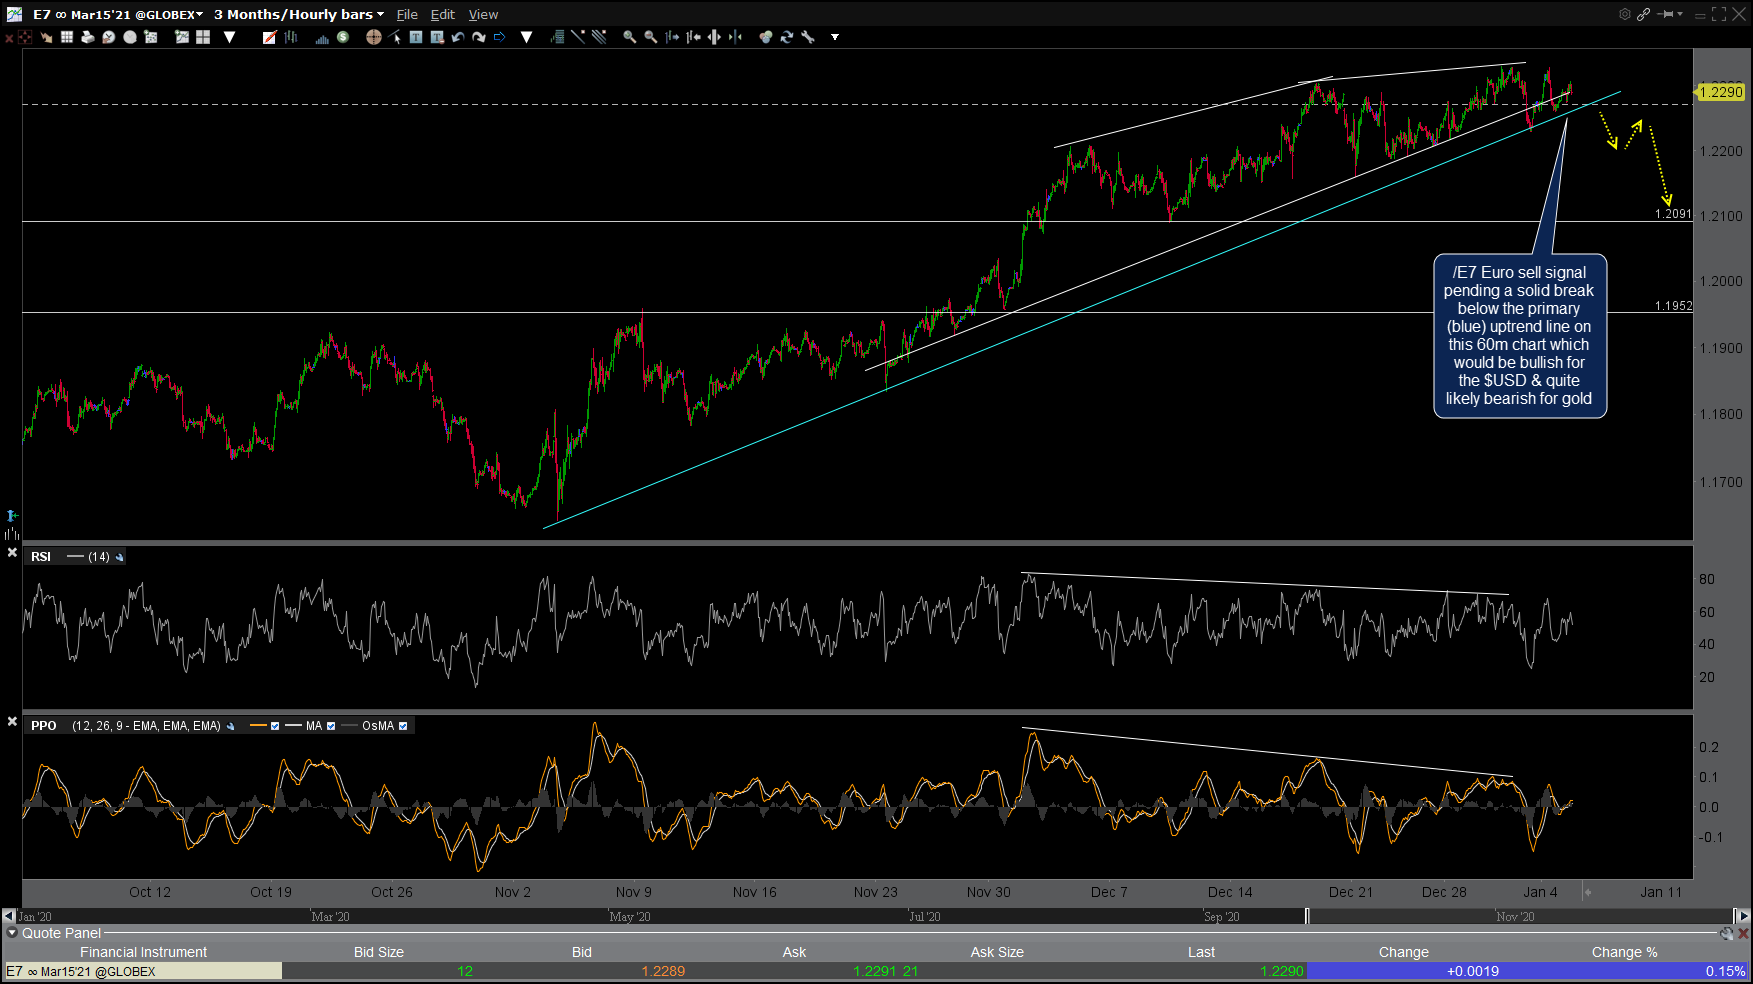
E7 60m Dec 5th
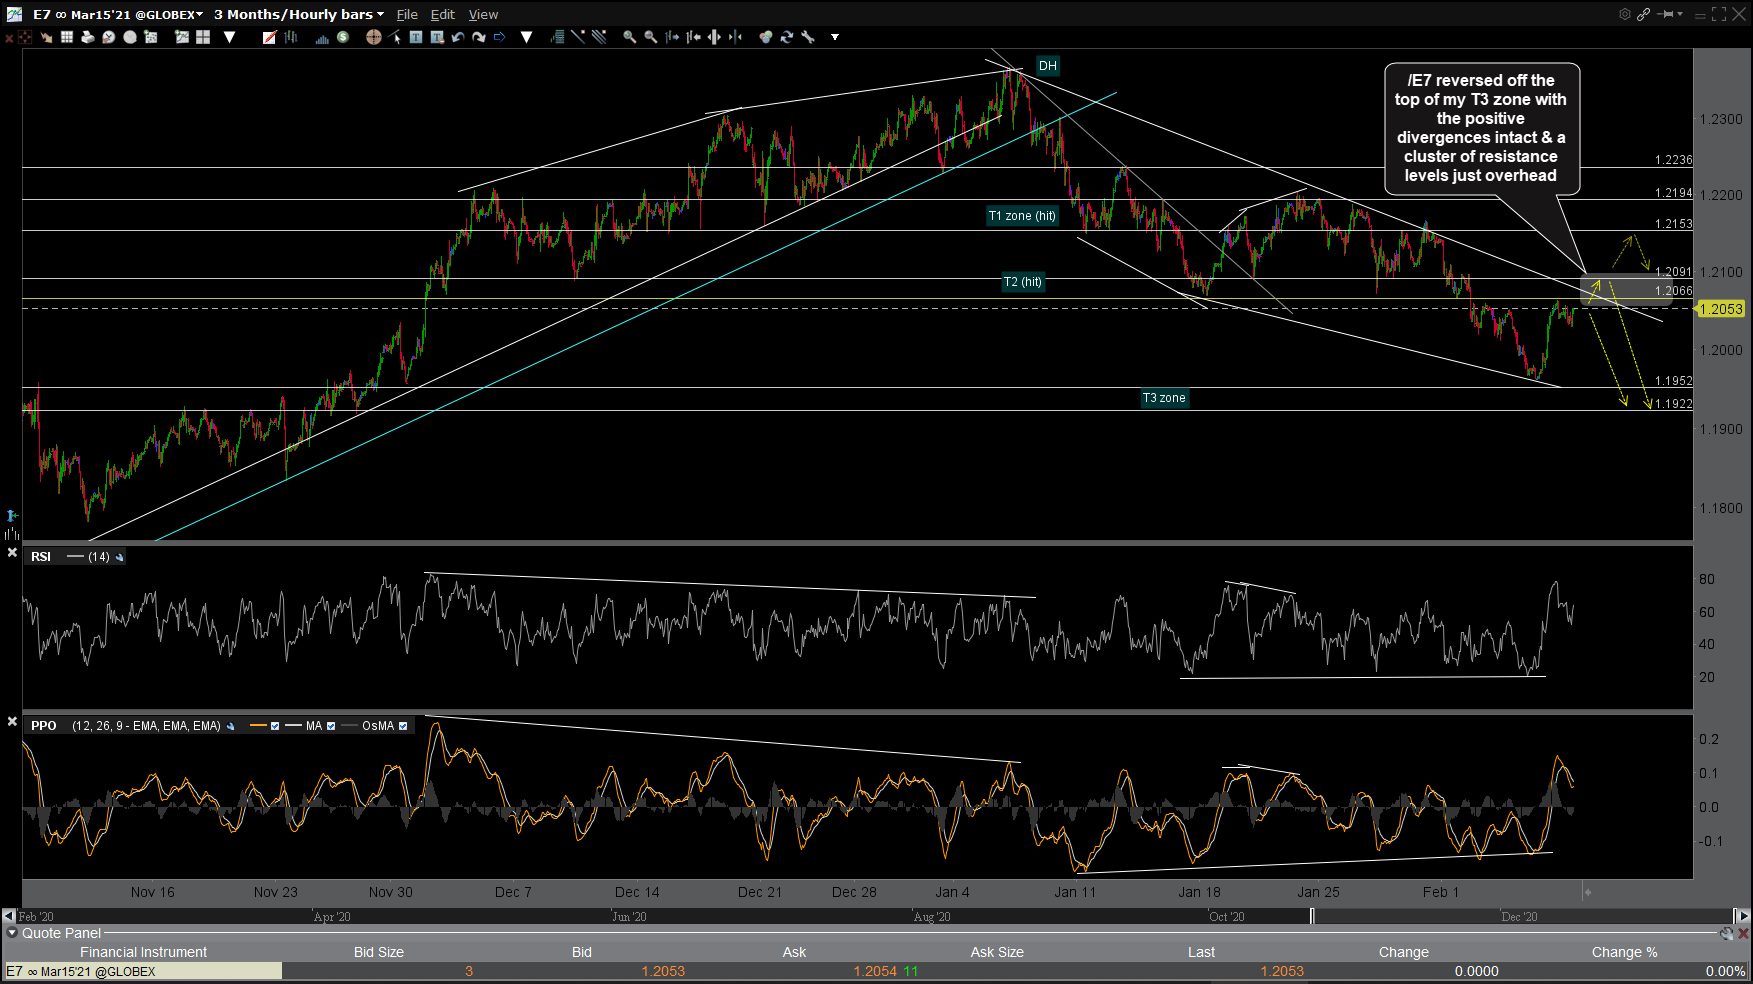
E7 60m Feb 8th
As the Euro & US Dollar are inversely correlated, the small bearish rising wedge breakdown following the 60-minute divergent high in /DX ($US Dollar Index futures) resulted in a pullback in the Greeback which was/is likely a corrective wave with more upside to come. Potential reversal points are the 91.081 & uptrend line support levels.
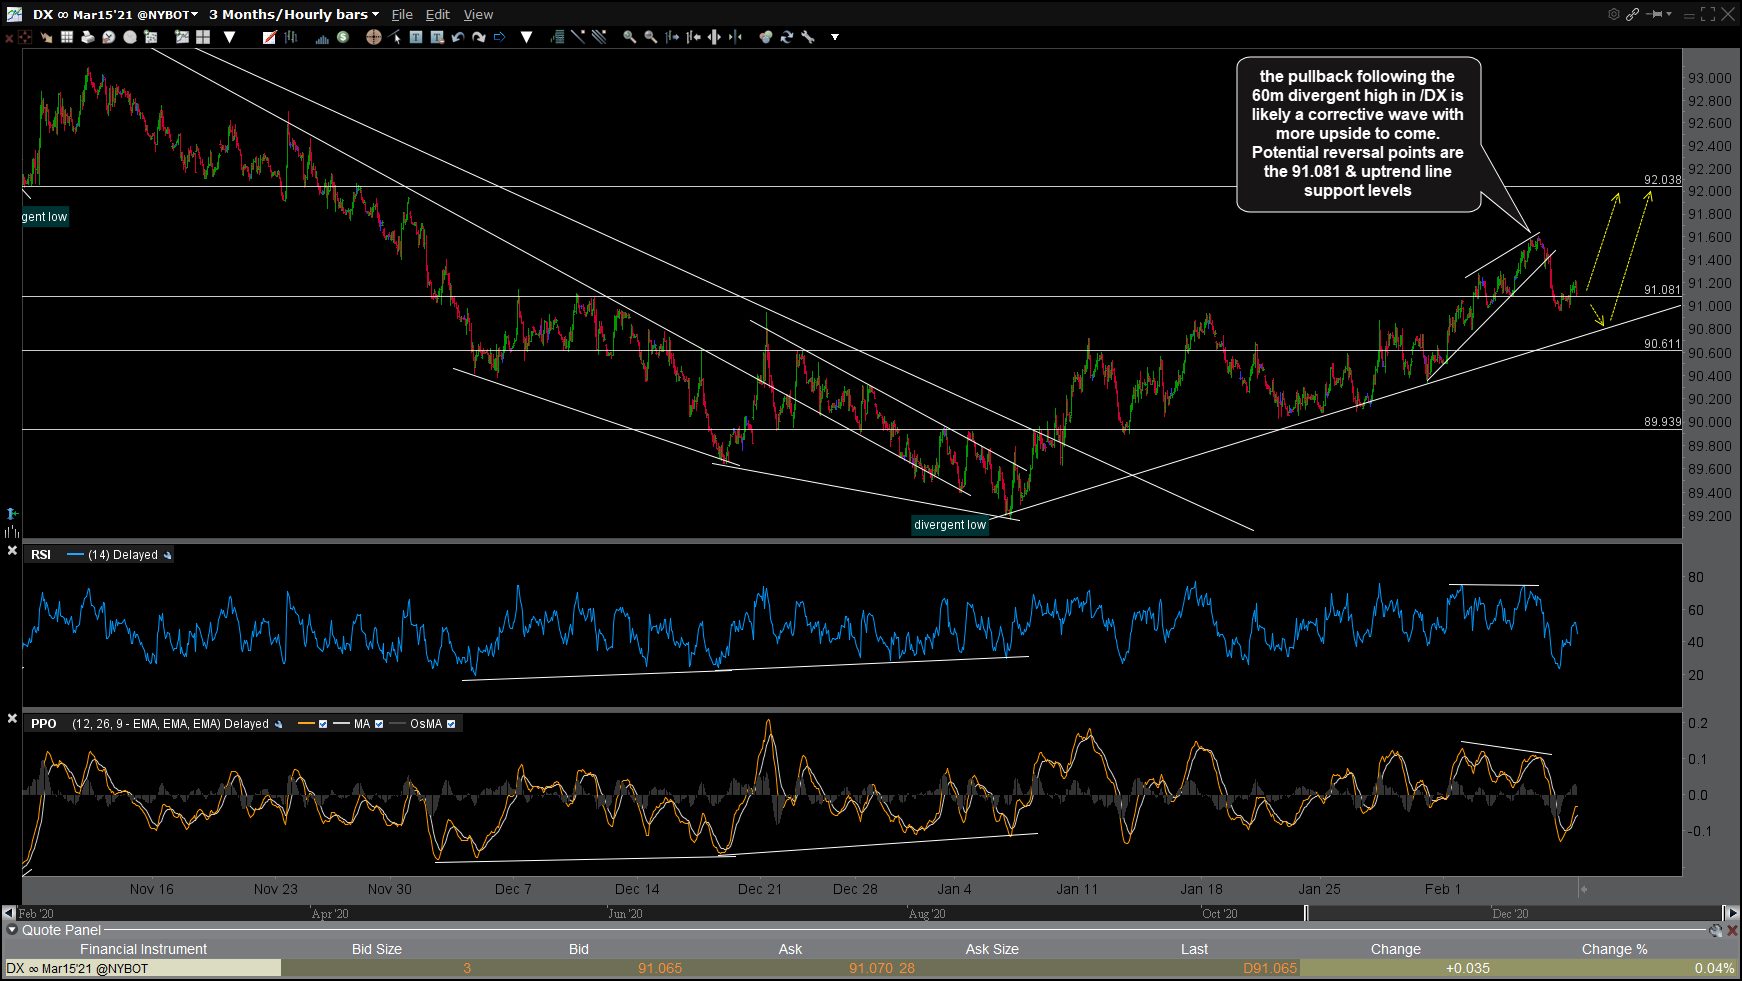
DX 60m Feb 8th
EUR/USD reversed just shy of the 1.19085 support on the daily time frame after hitting support with positive divergences on the 60-minute chart. Potential bounce targets are the 1.207ish level & trendline backtest.
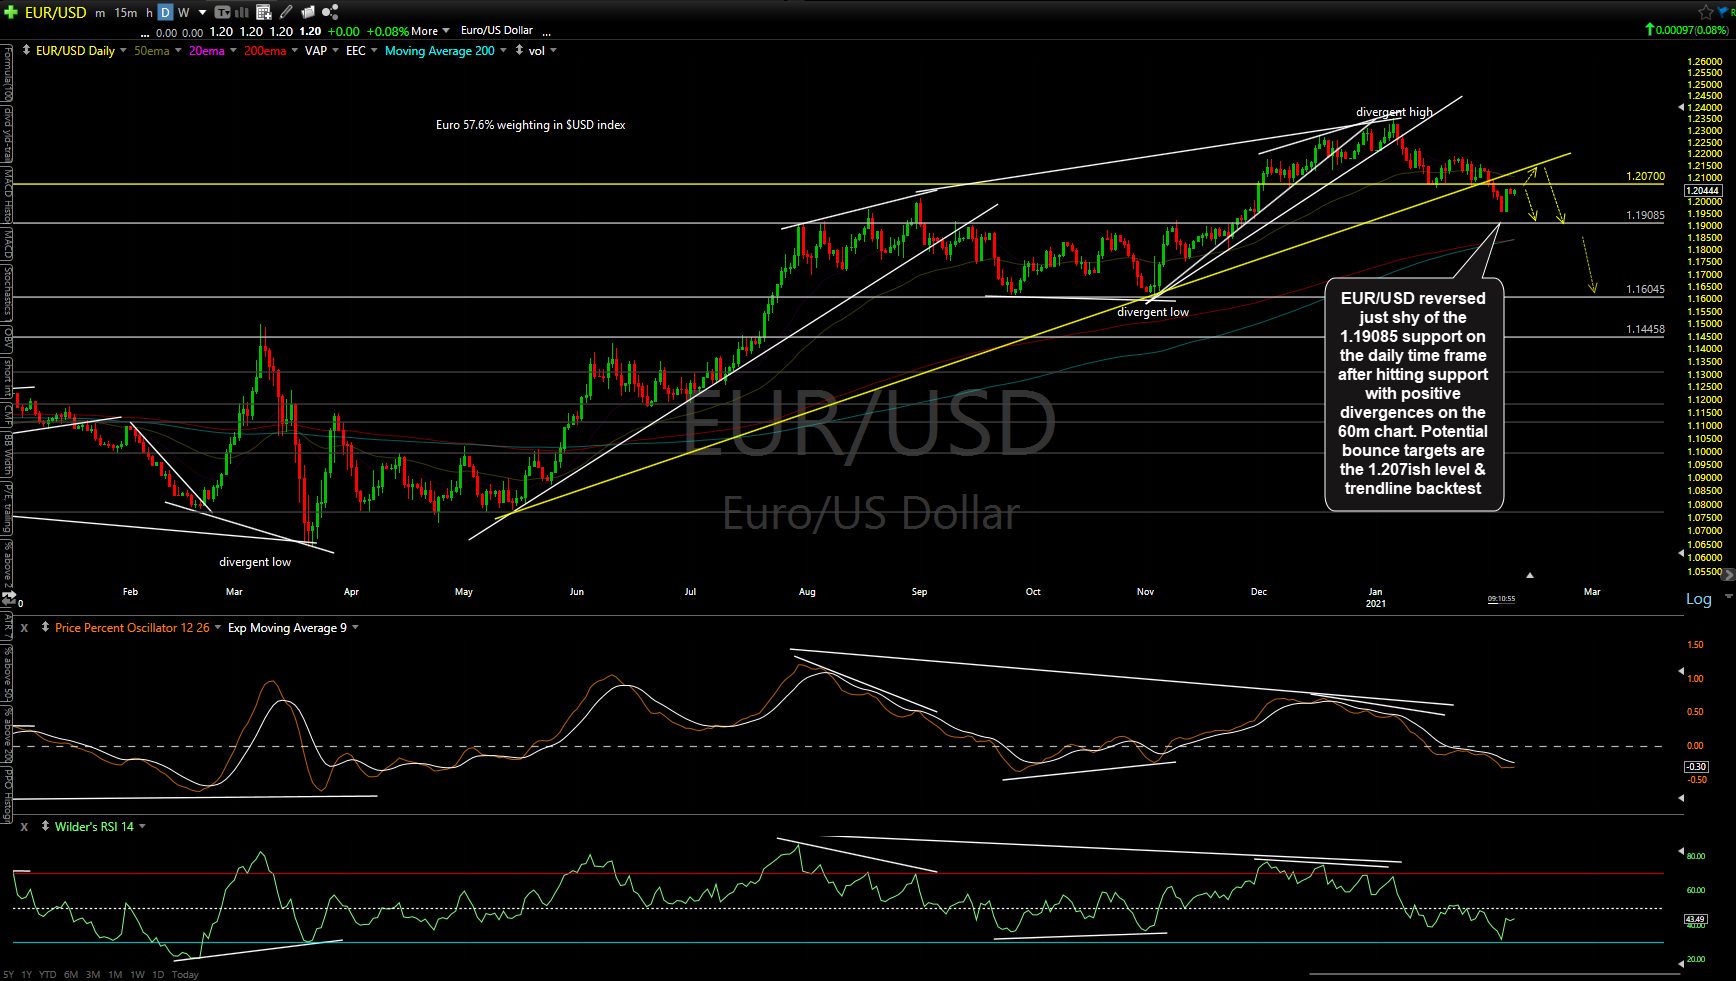
EUR-USD daily Feb 8th
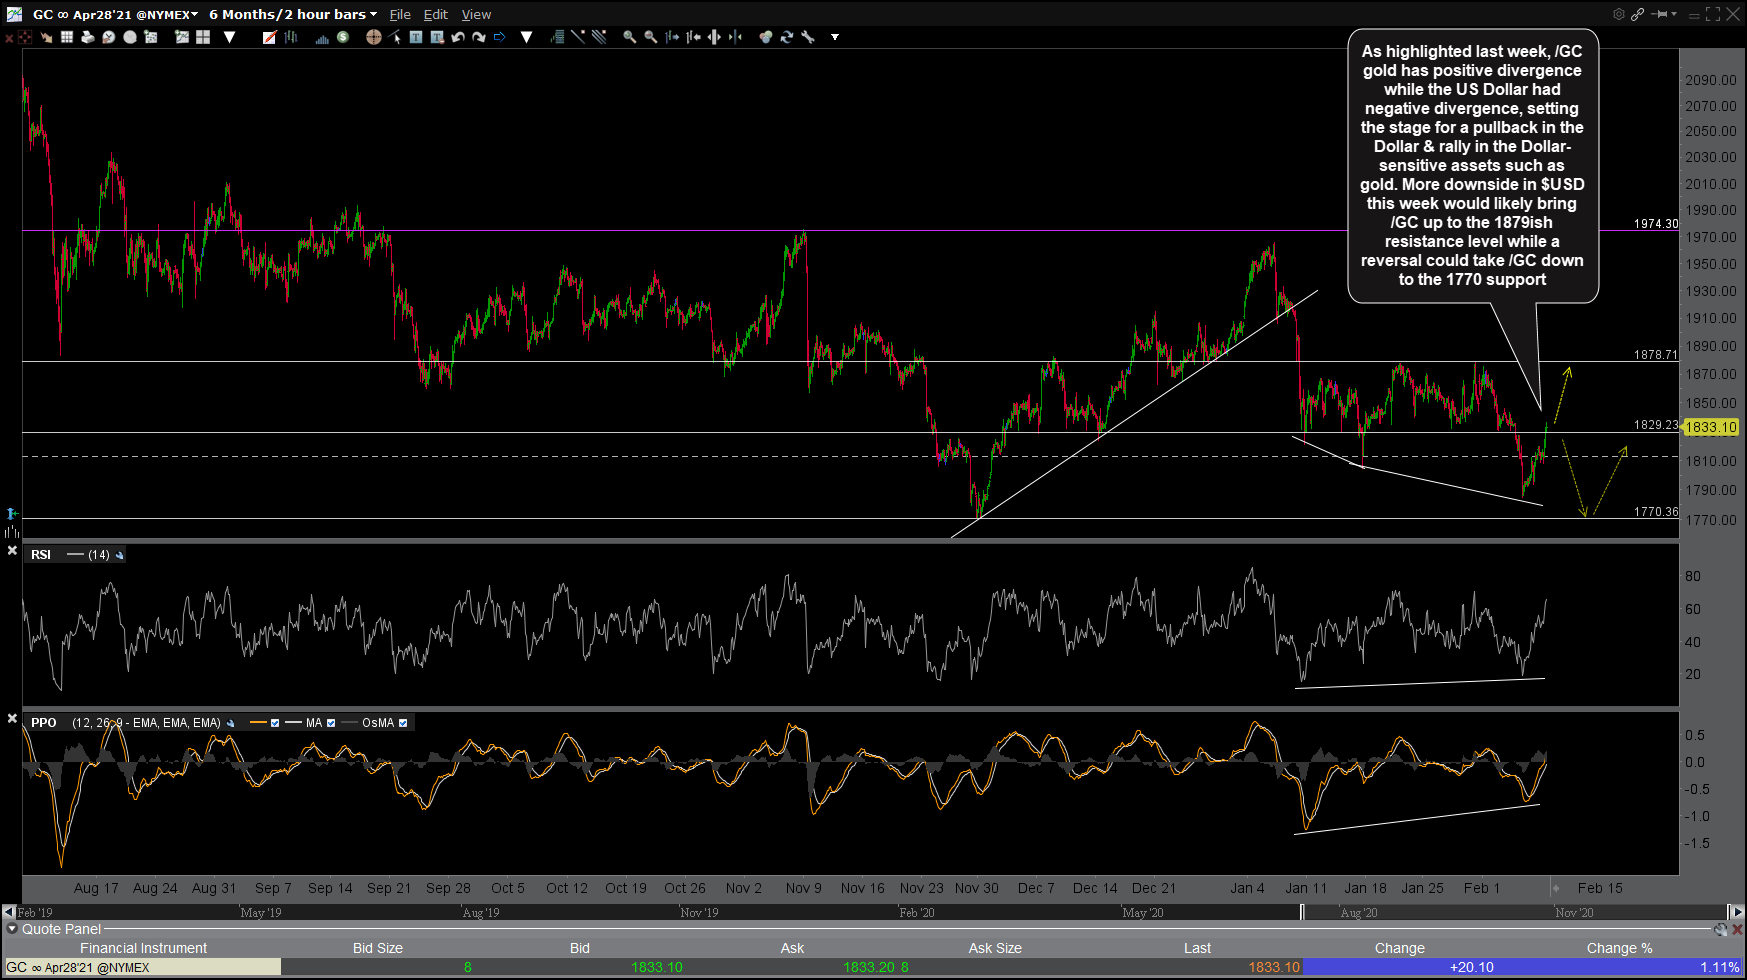
As highlighted last week, /GC gold had positive divergence on the 60-minute charts while the US Dollar had negative divergence, setting the stage for a pullback in the Dollar & rally in the Dollar-sensitive assets such as gold. More downside in $USD this week would likely bring /GC up to the 1879ish resistance level while a reversal could take /GC down to the 1770 support.
GC 60m Feb 8th