
/ES (S&P 500 futures) is currently trading at the intersecting trendline + 4100 price support with a reaction/tradable bounce here likely & a sell signal to come on a solid break below these dual support levels, reaction first or not. 60-minute chart below.
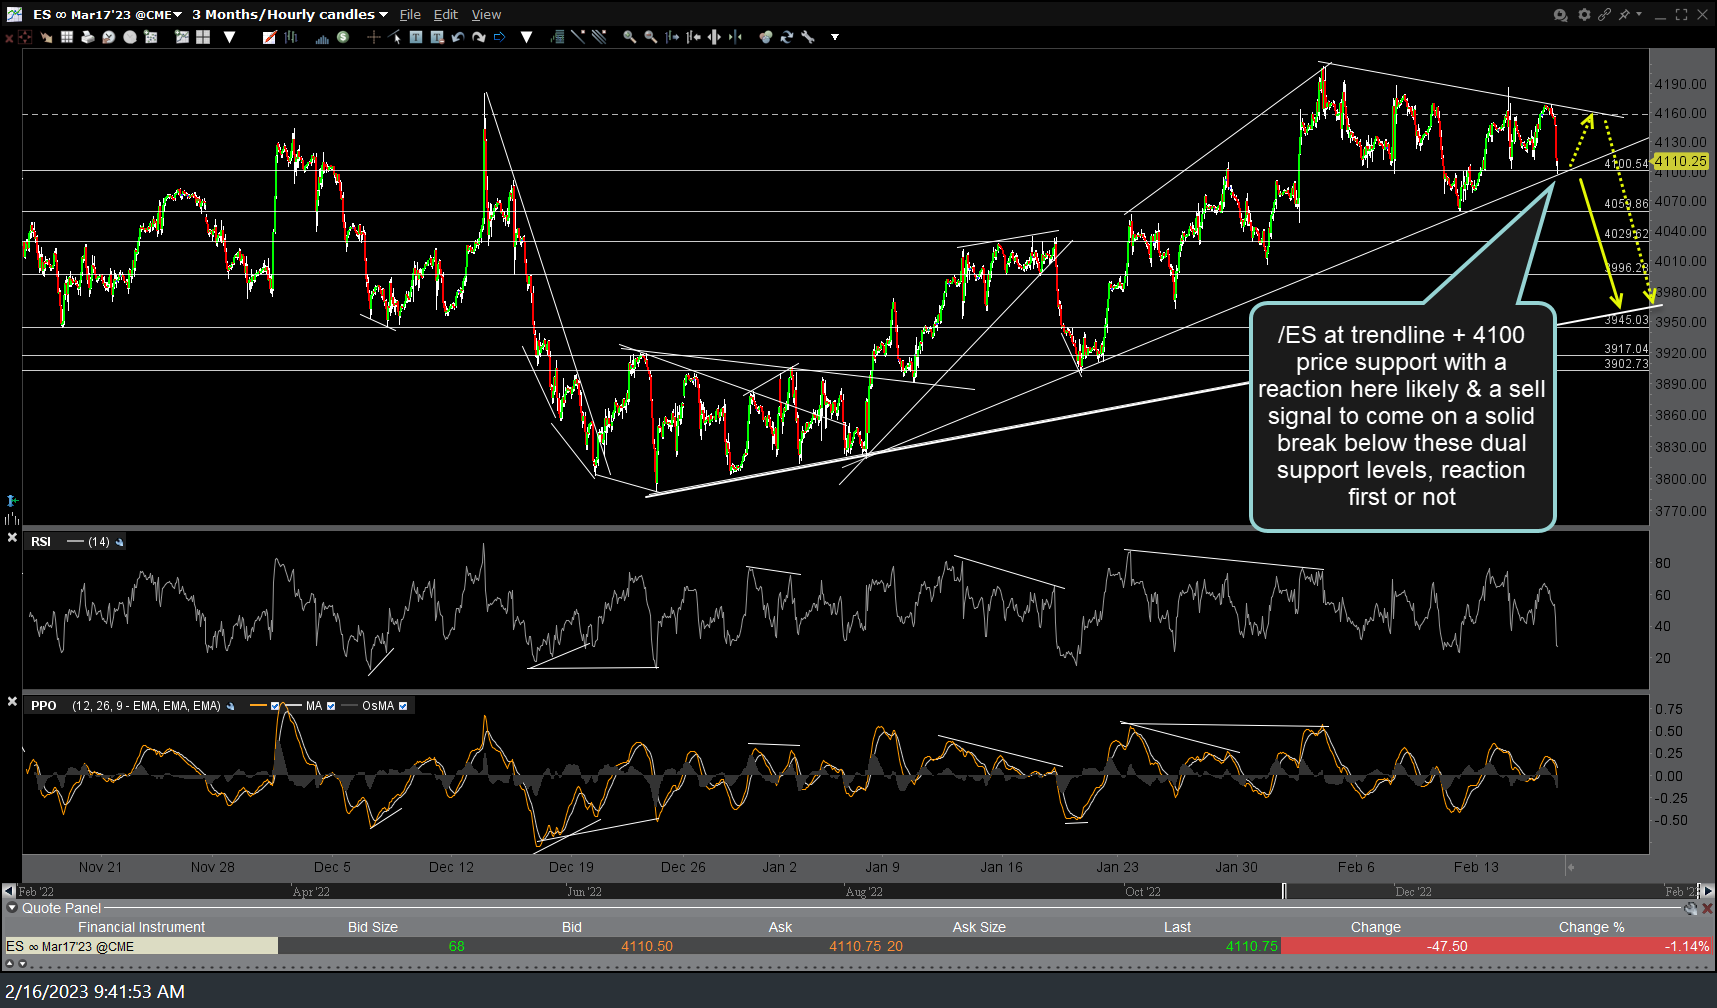
ES 60m Feb 16th
/RTY (Russell 2000 small cap index futures) is also at comparable uptrend line support with the reaction likely here and a sell signal to come on a solid break & 60-minute close below the trendline & 1921ish support, reaction first or not. These trendlines on $SPX & $RTY also align with the minor uptrend line support posted earlier on the $NDX. With all three indexes at fairly significant support levels coupled with a bullish near-term trend, it appears the odds for a tradable bounce off these support levels before the are ultimately taken out is the most likely scenario although there is a lot of hot air under the recent rally & certain bearish developments continuing to build so stay nimble if actively trading. 60-minute chart below.
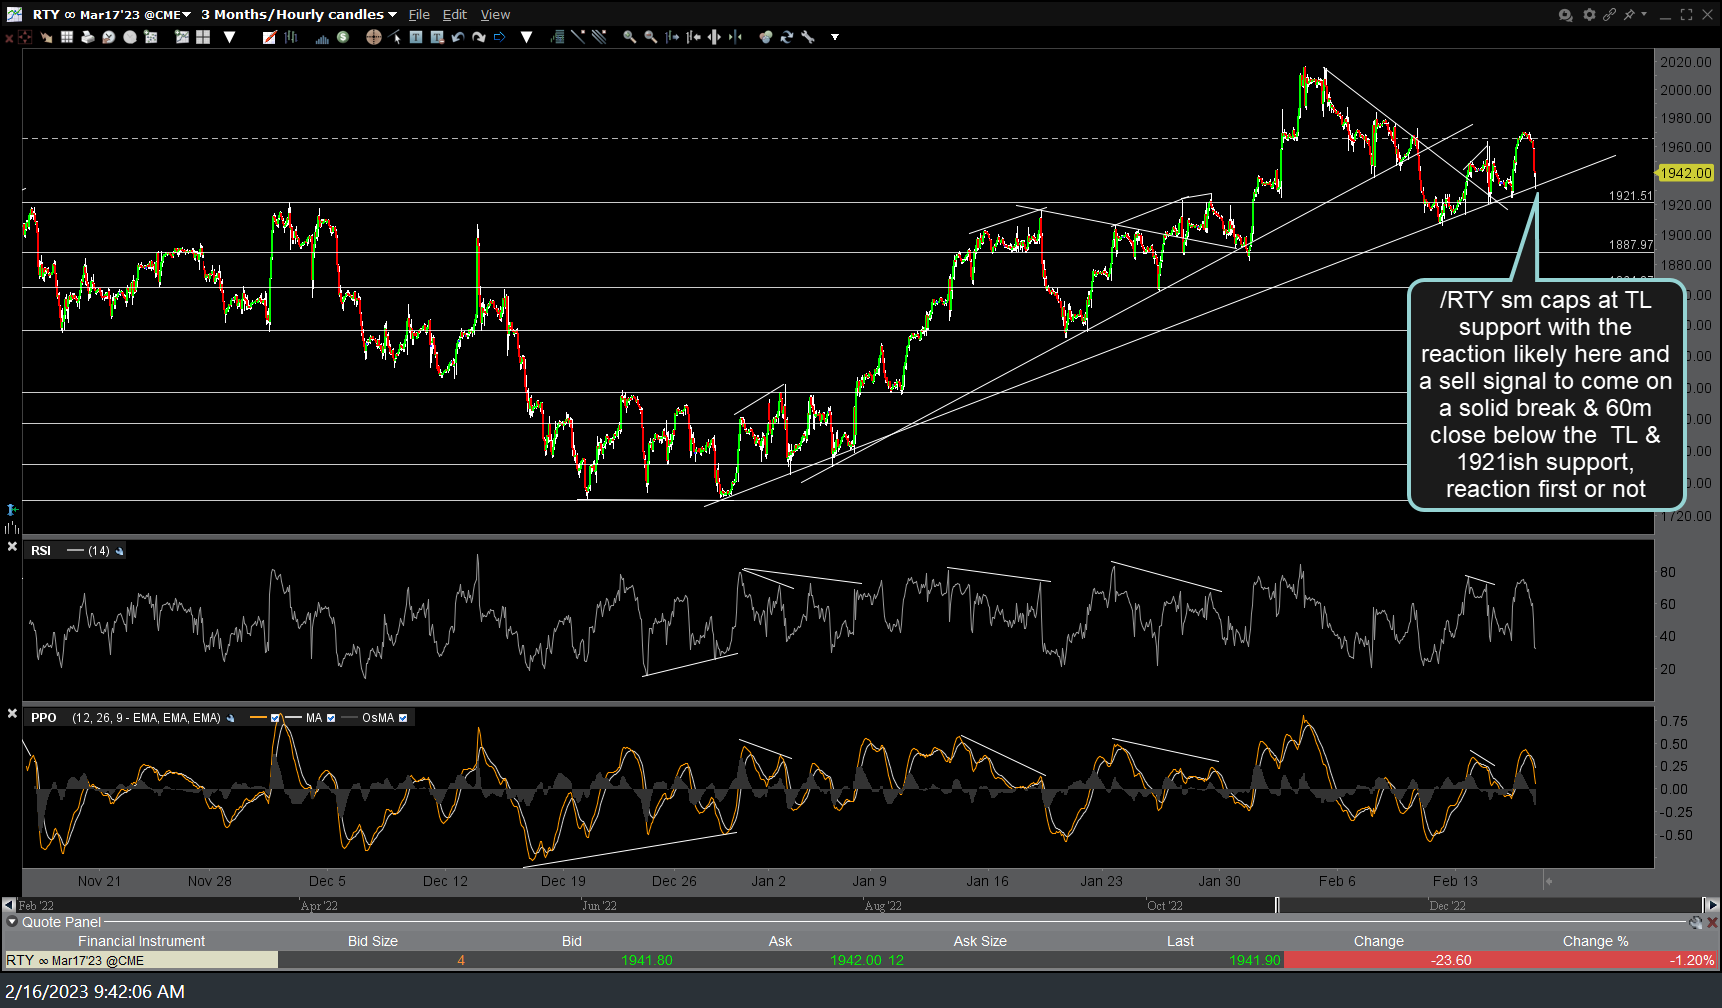
RTY 60 Feb 16th