/NQ is testing the 60-minute downtrend line & intersecting 15000ish resistance. A solid break above likely to spark a rally to any or all of the next 3 resistance levels. If rejected here, a break below the recent lows, especially if the divergences are taken out would be quite bearish.
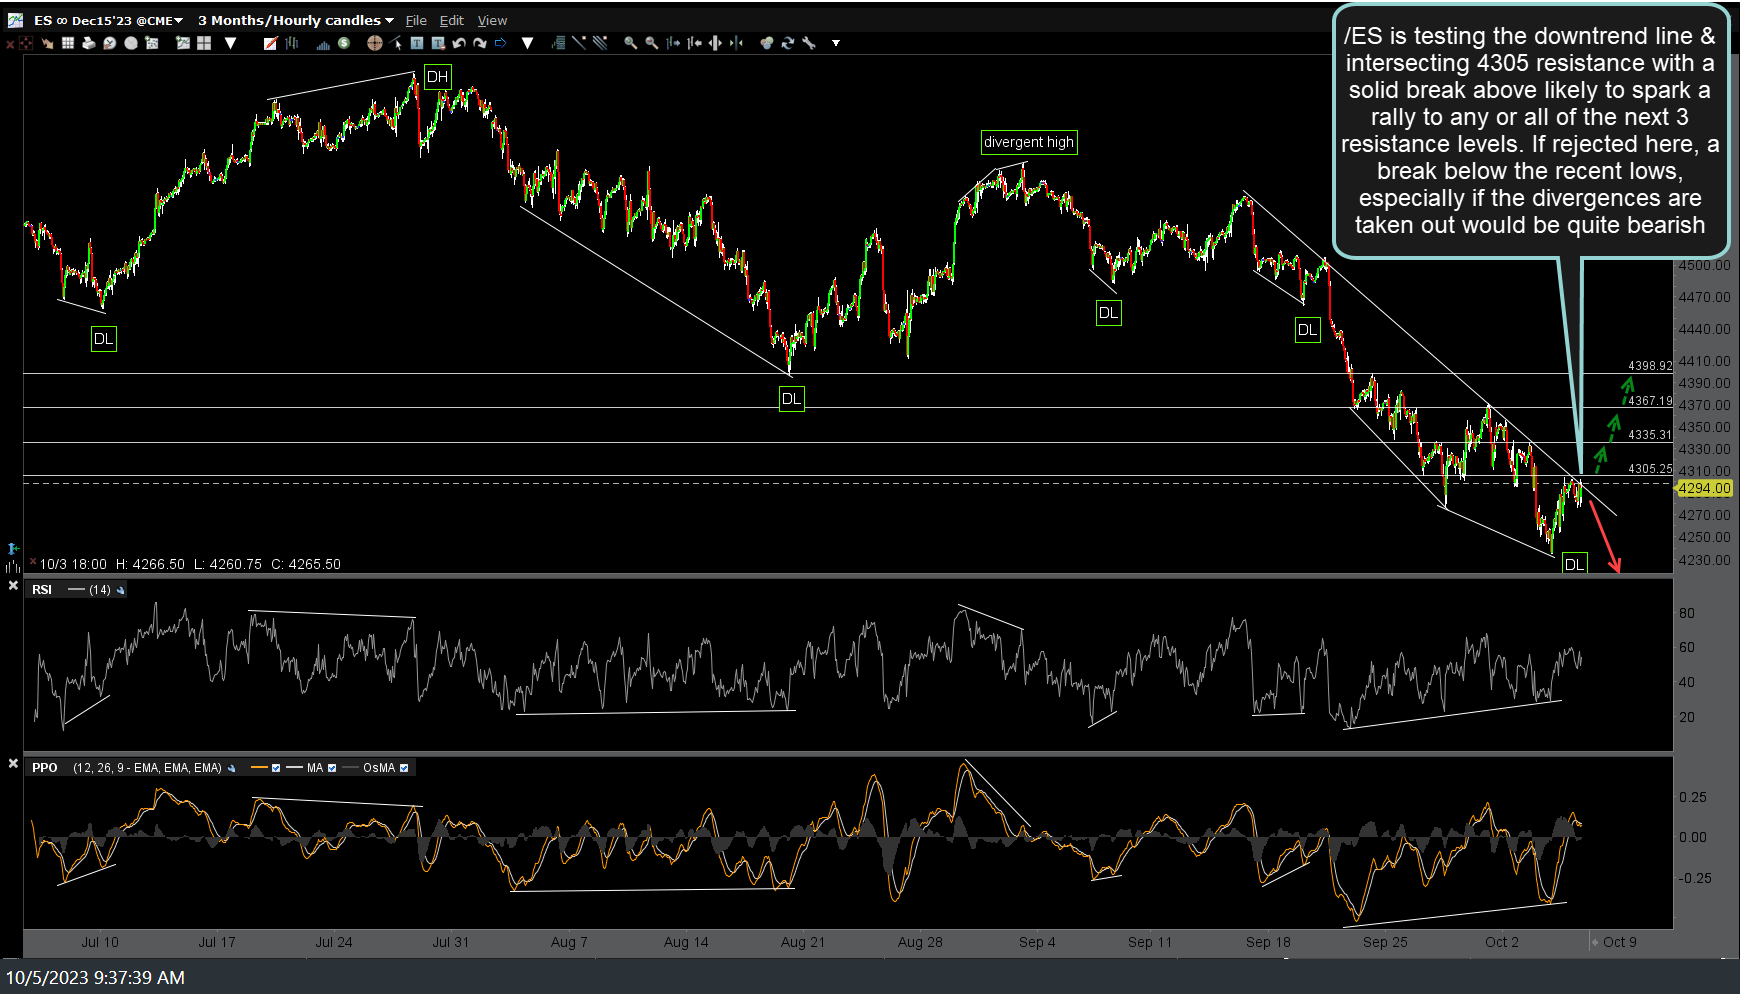
Likewise, /ES (S&P 500 futures) is testing its comparable 60-minutes downtrend line & intersecting 4305 resistance with a solid break above likely to spark a rally to any or all of the next 3 resistance levels. If rejected here, a break below the recent lows, especially if the divergences are taken out would be quite bearish.
Q: Is this wishy-washy analysis? (i.e.- the stock market is either going to go up or down from here.. how is that helpful!)
A: Only if you think it is. I don’t.
My take is that both the S&P 500 as well as the Nasdaq 100 have both rallied back up to key resistance levels while solidly in a near-to-intermediate-term downtrend. As I like to say, resistance is resistance until & unless taken out. As such, if the indexes get rejected here & take out the recent lows & especially the positive divergences that are currently in place, then the odds for another & most likely powerful leg down will be quite good IMO.
Should the indexes make solid breakouts that aren’t just brief pops that fail (i.e.- whipsaws or false breakouts), then the odds favor additional upside to any or all of the potential price targets (resistance levels) shown at my arrow breaks.
Bottom line: This is not a good time to be married to any one “the market must do this or that” scenario (and positioning), rather it is best to react to the charts as they develop & position accordingly. Also, keep & eye on the “Things To Watch” that I’ve been highlighting recently, including but not limited to US Treasuries & CA municipal bonds, banks & non-bank financials, key nearby technical levels on the Magnification 7, etc..
With all that being said, also keep in mind the recent bearish developments that I’ve highlighted on the more significant daily & weekly charts in recent weeks as I will factor that in with an extra weighting when the intermediate (intraday) charts, such as the 60-minute time frame, are providing mixed signals.


