
Those 60-minute bullish falling wedge patterns on /ES (S&P 500 futures) and /NQ (Nasdaq 100) both have text-book breakouts & backtests, triggering objective long entries/buy signals on the indexes with either tight stops somewhat below the breakout level or a more liberal stop below yesterday’s lows. Updated 60-minute charts below.
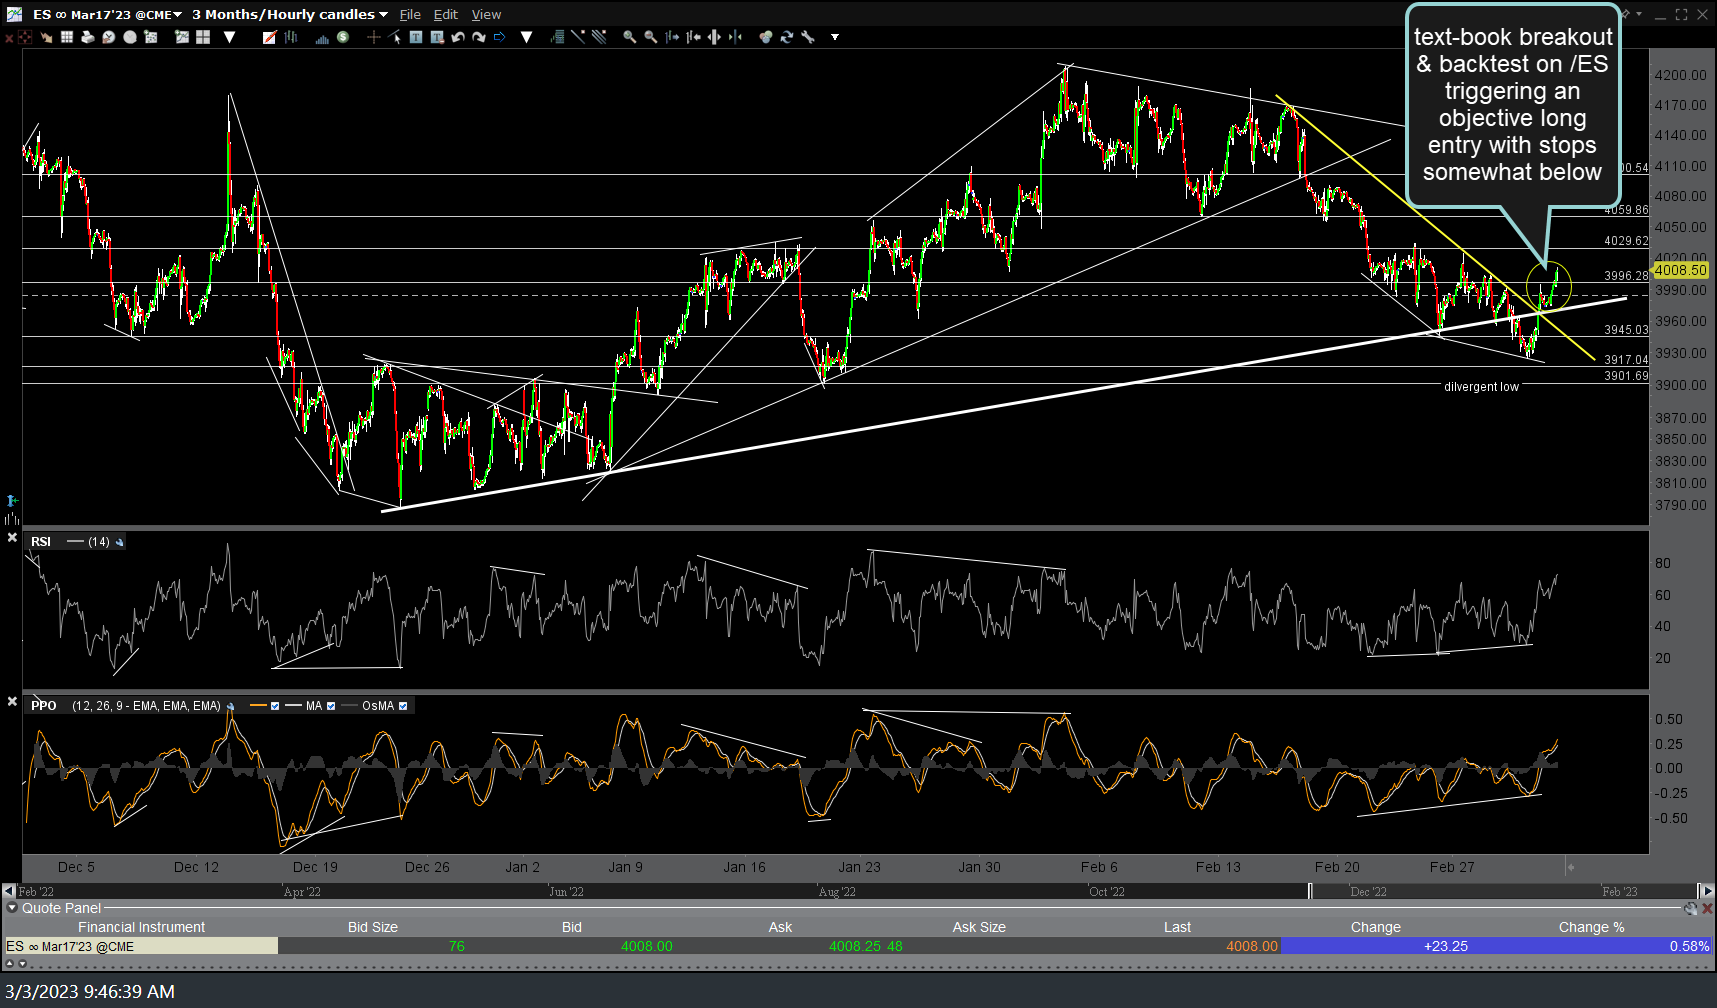
ES 60m March 3rd
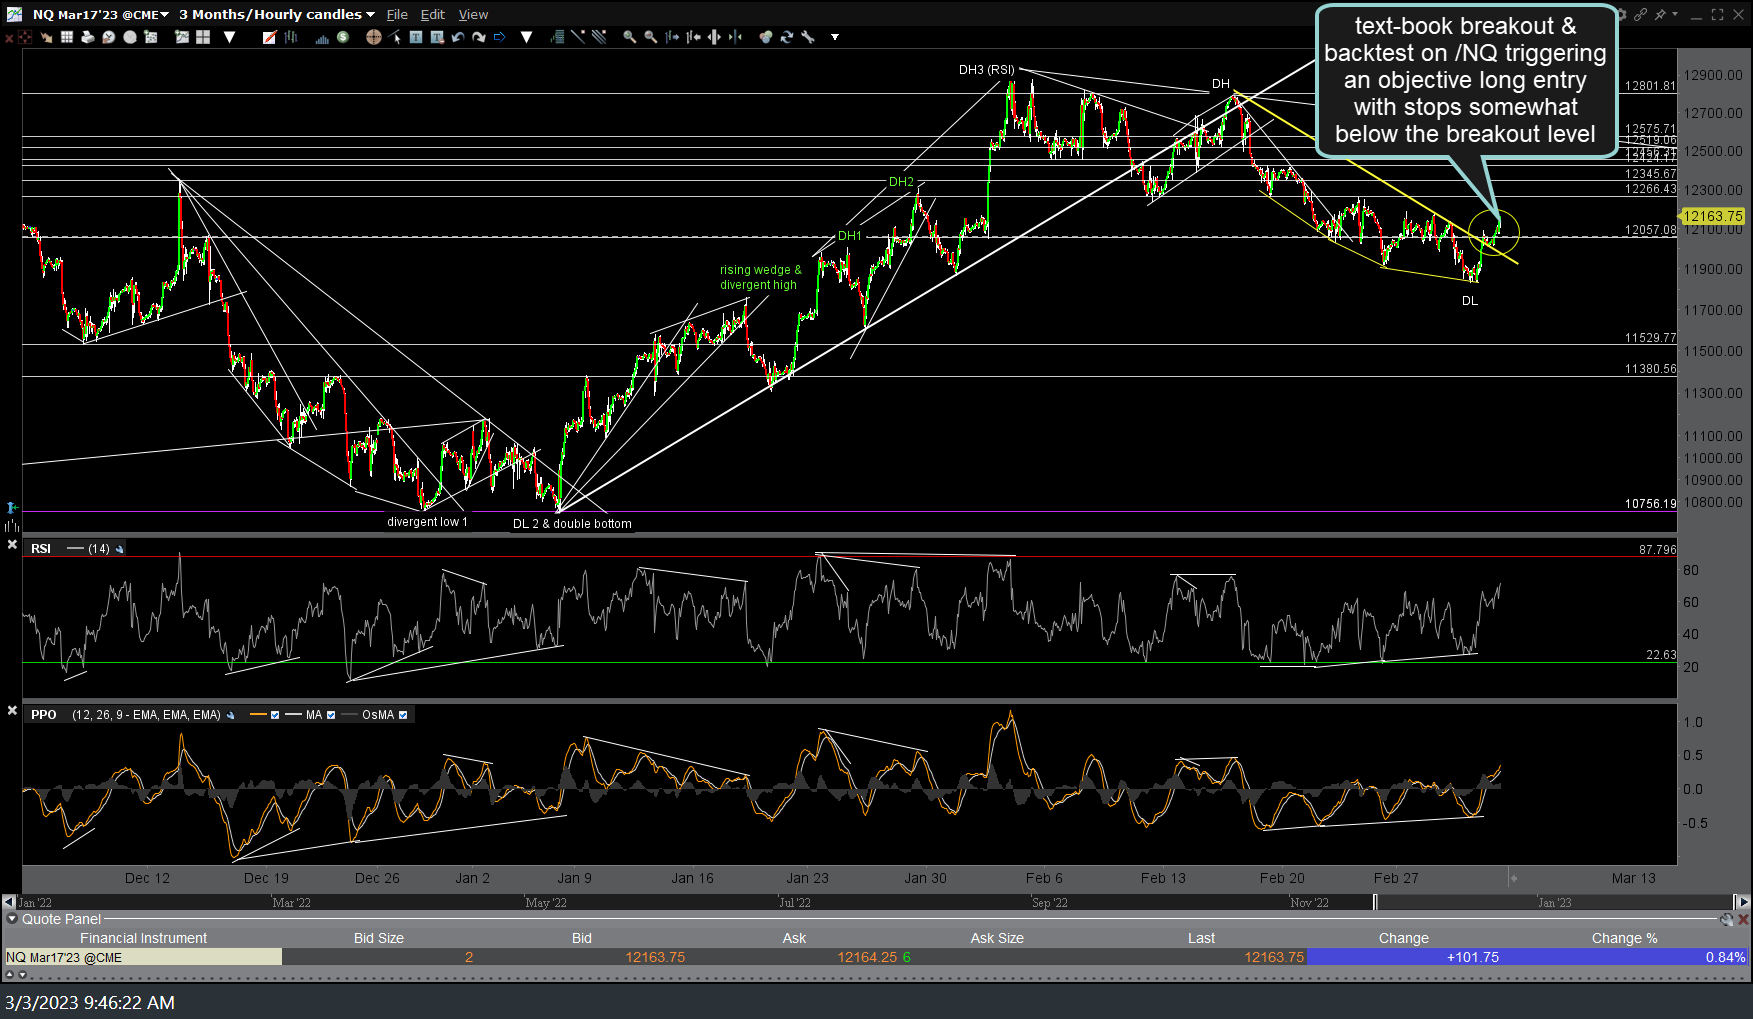
NQ 60m March 3rd
I’ll be heading down to the (Florida) Keys shortly for the weekend & won’t be posting any updates until I return unless something crazy happens today. As of now, nothing has changed in the longer-term outlook for the stock market as the major indices continue to successfully defend the key support levels just below (200-day SMA’s on both SPY & QQQ as well as the primary downtrend line on SPY).
These 60-minute bullish falling wedge breakouts have the potential to carry the market higher today & into next week although I have to say I remain a bit skeptical of just how far this early-session rally will continue, despite what appear to be text-book looking breakouts above the wedges, complete with positive (i.e.- bullish) divergences. The reason for a more liberal stop below yesterday’s lows, for those going long on these breakouts, is due to the fact that both QQQ & SPY both dipped slightly below their respective 200-day SMA’s yesterday (with SPY also making another backtest of its primary bear market downtrend line from above), followed by a strong reversal to close the day solidly back above those key support levels. As such, a solid break below yesterday’s lows has the potential to usher in a powerful wave of selling as there is undoubtedly a large cluster of stops sitting below those key support levels.
Of course, a break below yesterday’s lows would also mean that these wedge breakouts have failed (also bearish) and would provide objective an objective short entry or add-on to swing or trend traders looking to short the next leg down.
Stay nimble!
-rp