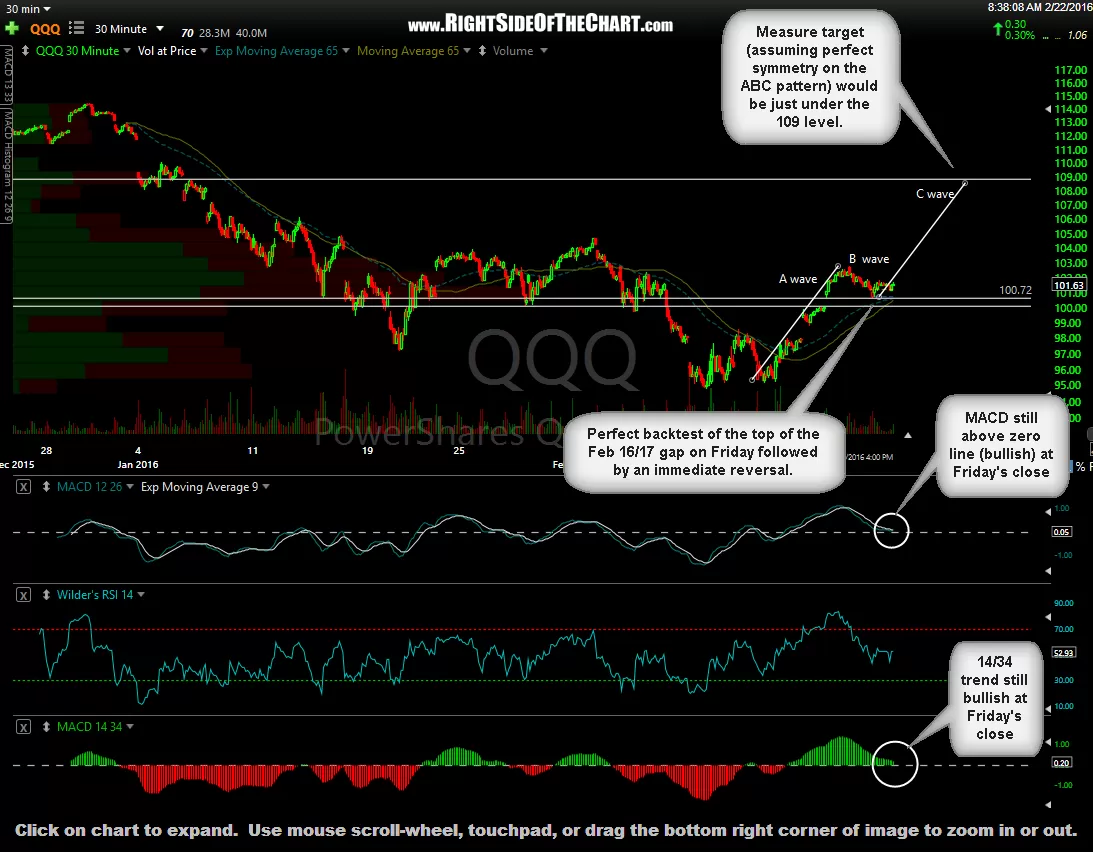
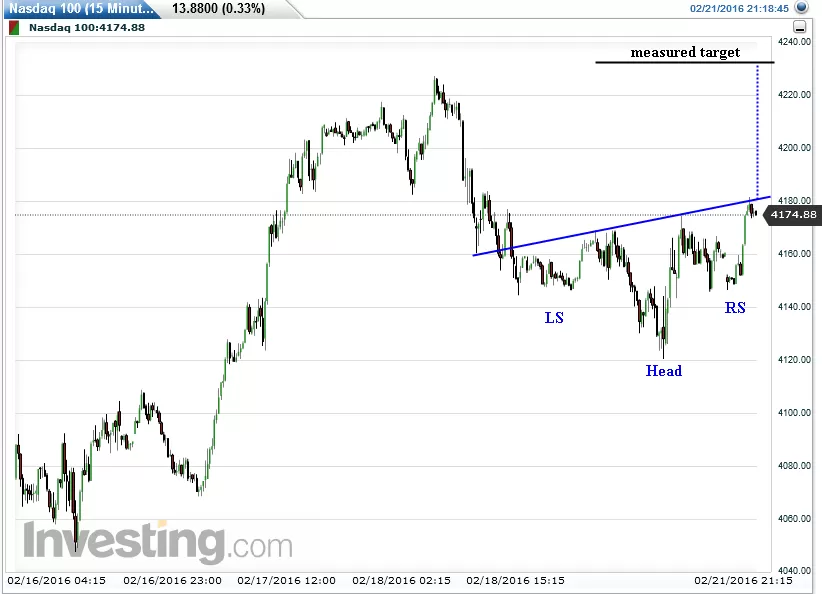
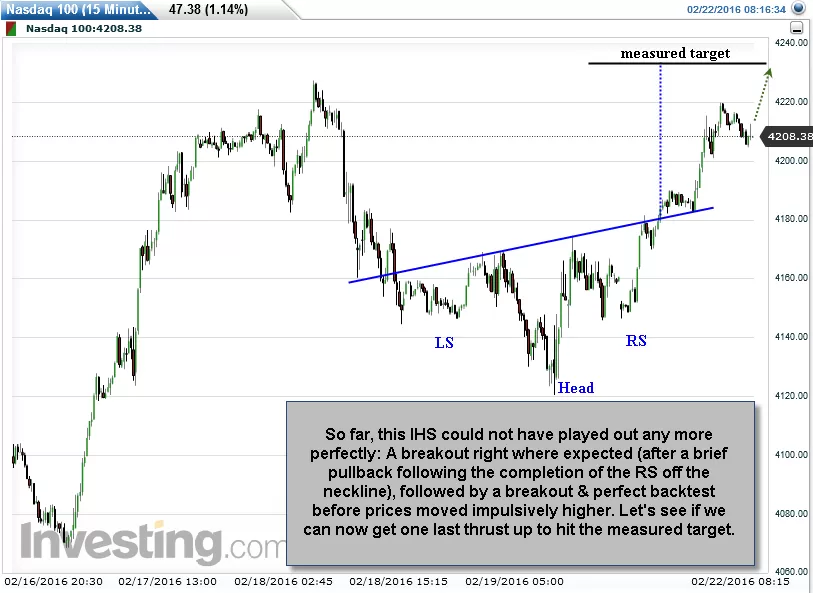
So far in pre-market trading, the bull flag patterns that were discussed on Friday & in last night’s market outlook video have broken to the upside. In addition to those flag patterns (best viewed on the 30 or 60-minute time frames), this inverse head & shoulders pattern (IHS) on the Nasdaq 100 futures was posted at 9:18pm ET in the trading room last night. So far, that IHS could not have played out any more perfectly: A breakout right where expected (after a brief pullback following the completion of the RS off the neckline), followed by a perfect backtest before prices moved impulsively higher. Let’s see if we can now get one last thrust up to hit the measured target.
-
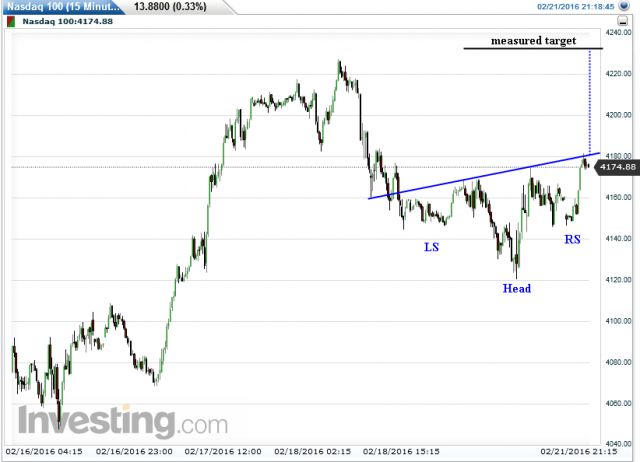
- NQ 15-minute Feb 21st
-
- NQ 15-minute Feb 22nd
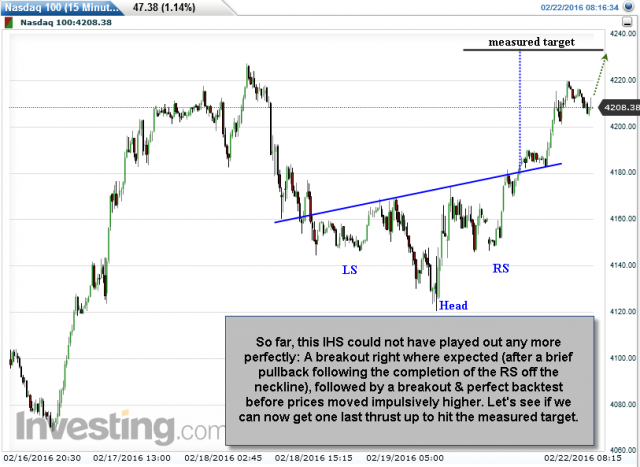
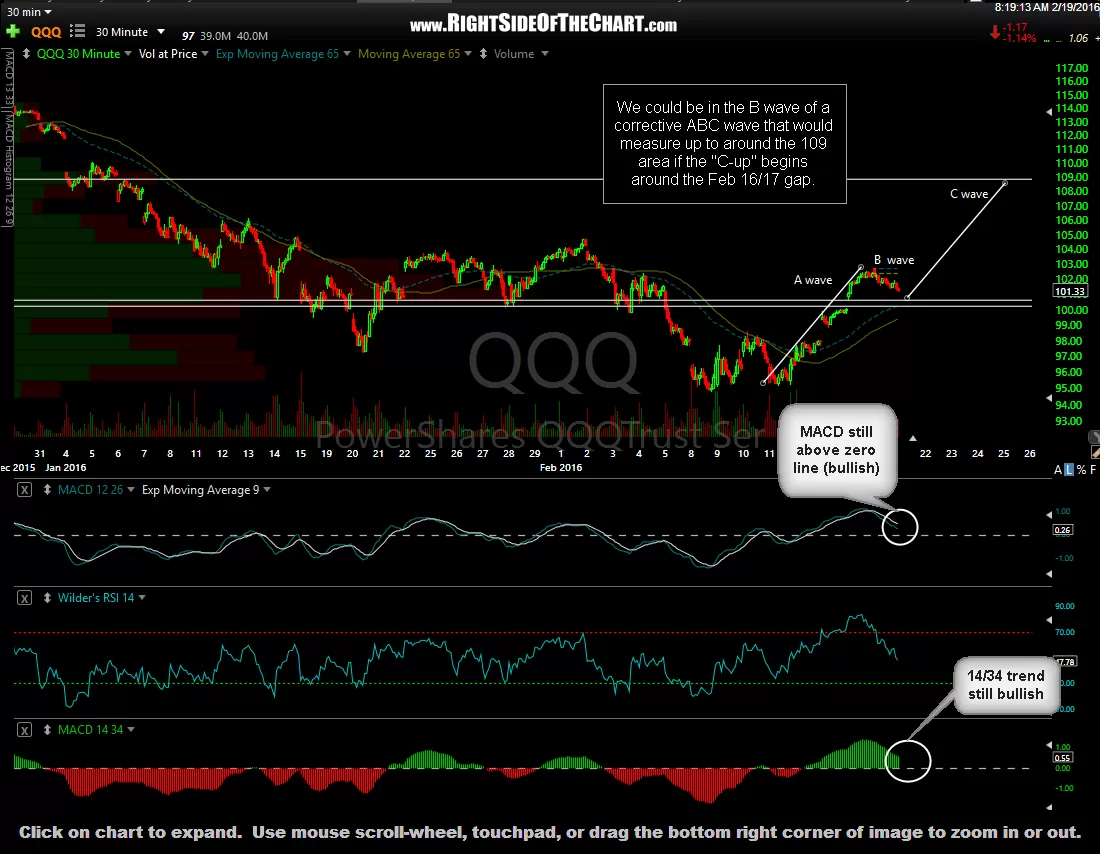
The first 30-minute QQQ chart below was posted on the front page of the site on Friday morning before the market open, showing a scenario with the Q’s continuing to flag lower to the top of the Feb 16/17th gap before reversing & kicking off the “C” up in an ABC corrective pattern. That “C” up, which the markets appear to be in now following the breakout & rally in the futures overnight, measures to just under the 109 level, assuming perfect symmetry in the ABC pattern (which is also the same as the bull flag measured projection, i.e.- the length of the flagpole added to the lowest point in the bull flag). The net effect of a rally in equities has been and will likely continue to be bearish for gold (GLD) & especially the extremely overbought mining stocks (GDX) as the most recent sharp rally was largely driven by a flight-to-safety as equities were under heavy selling pressure.
-
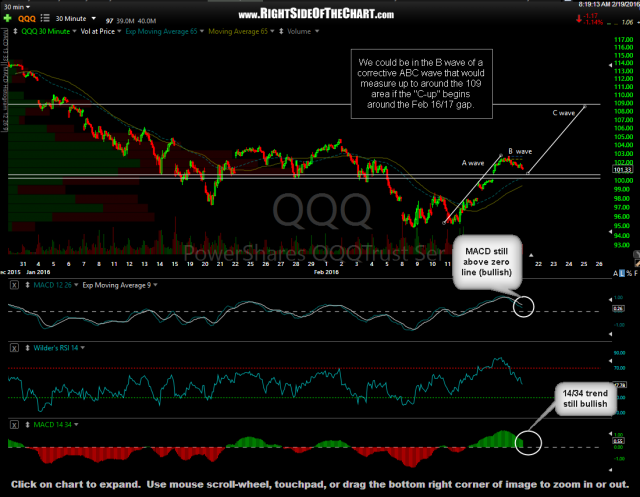
- QQQ 30-minute Feb 19th
-
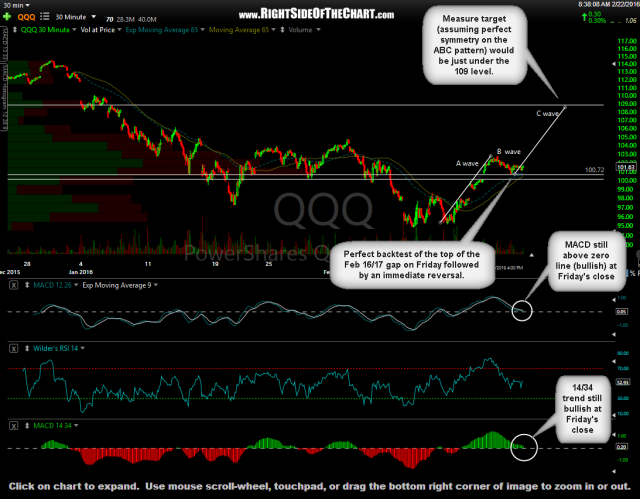
- QQQ 30-minute Feb 22nd