
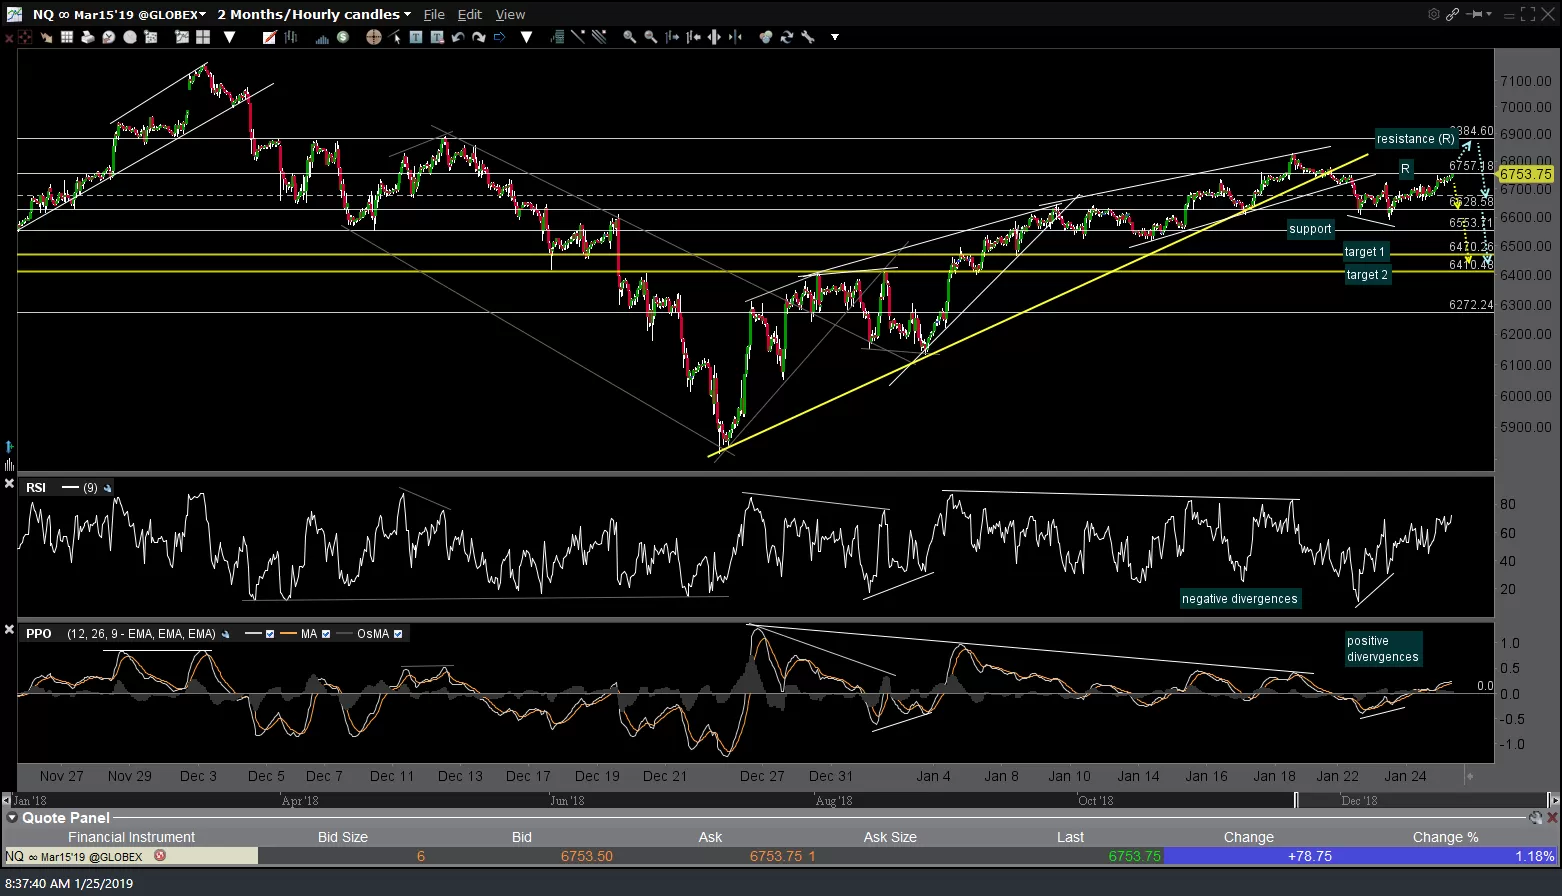
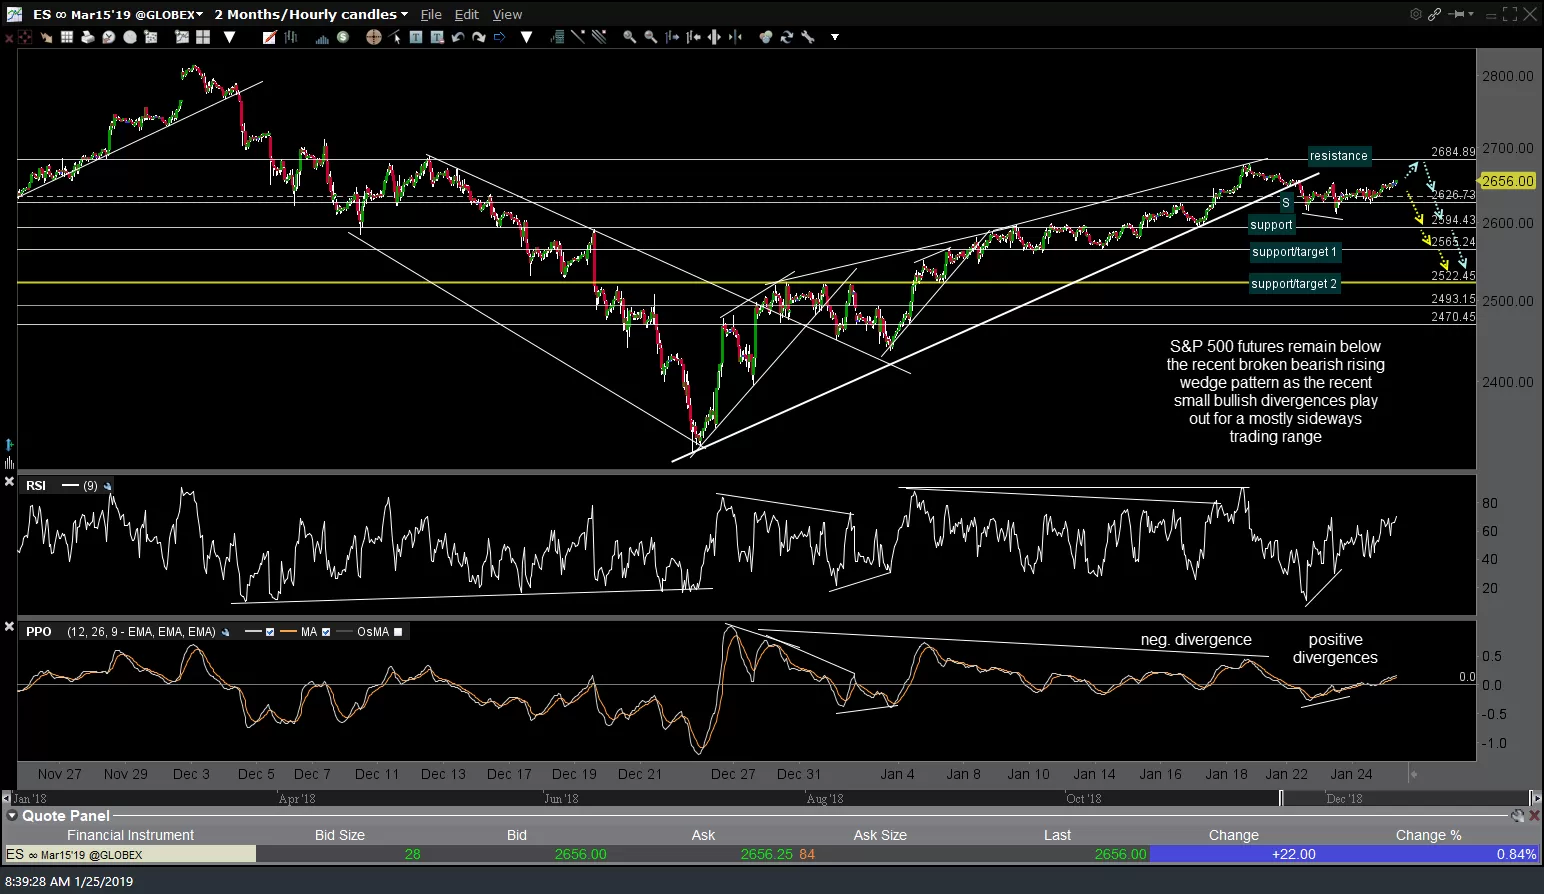
Here are the /ES (S&P 500) and /NQ (Nasdaq 100) E-mini futures 60-minute charts with support, resistance & price target levels. Hard to say whether or not the recent small positive divergences that formed following the breakdown below the bearish rising wedge patterns will play out for a little more upside and/or sideways trading or not but if so, it would appear that the 6885 level on /NQ and the 2685 level on /ES would likely cap any additional upside over the next few trading sessions. The QQQ active short trade still looks fine for now & I don’t see any reason to modify any of the trade parameters at this time.
-
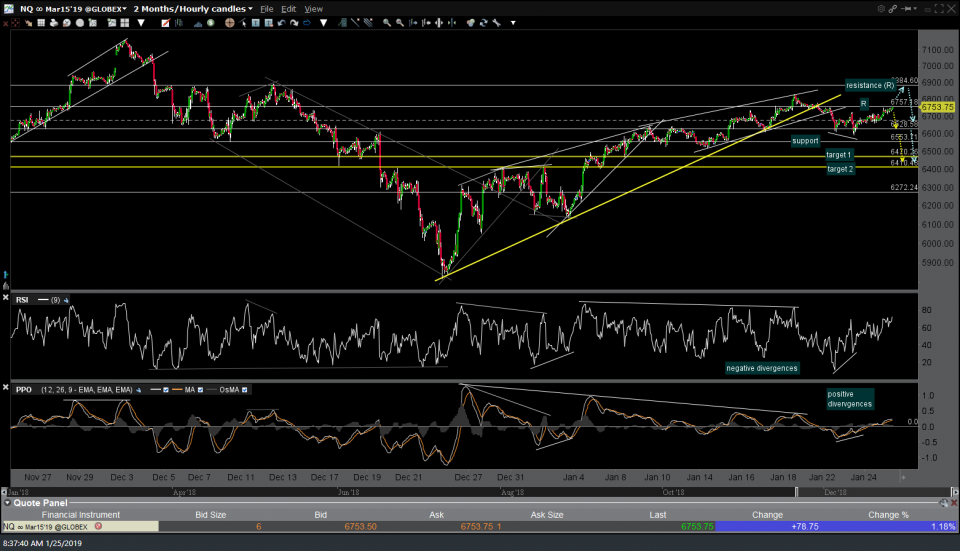
- NQ 60-min Jan 25th
-
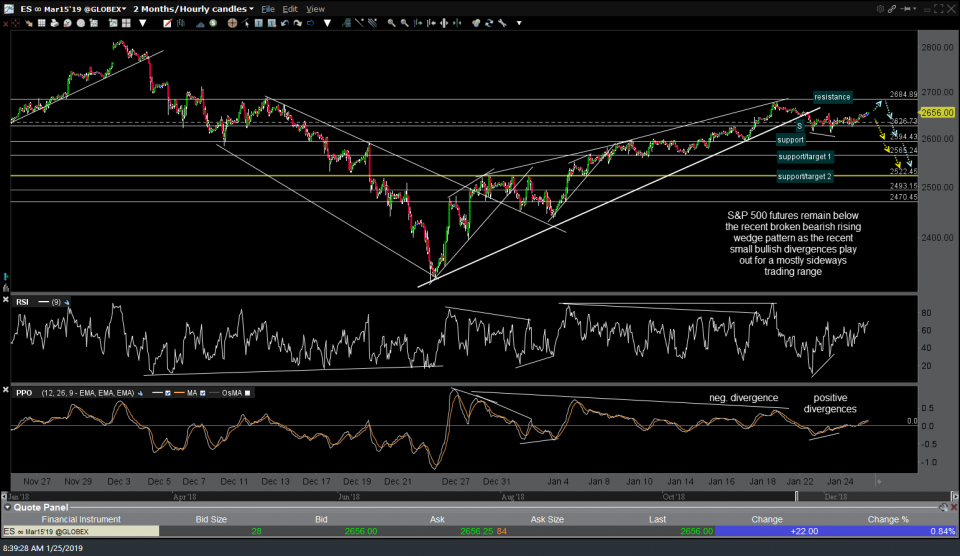
- ES 60-min Jan 25th
.