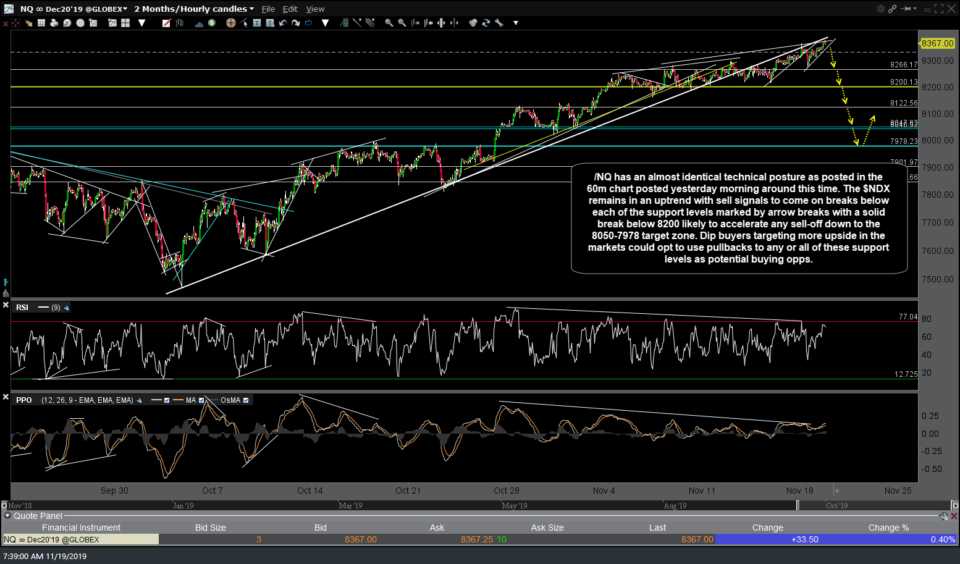
/NQ has an almost identical technical posture as posted in the 60-minute chart posted yesterday morning around this time as it has set up within another small wedge pattern while backtesting the uptrend line off the early Oct lows from below. The $NDX remains in an uptrend with sell signals to come on breaks below each of the support levels marked by arrow breaks with a solid break below 8200 likely to accelerate and sell-off down to the 8050-7978 target zone. Dip buyers targeting more upside in the markets could opt to use pullbacks to any or all of these support levels as potential buying opps.
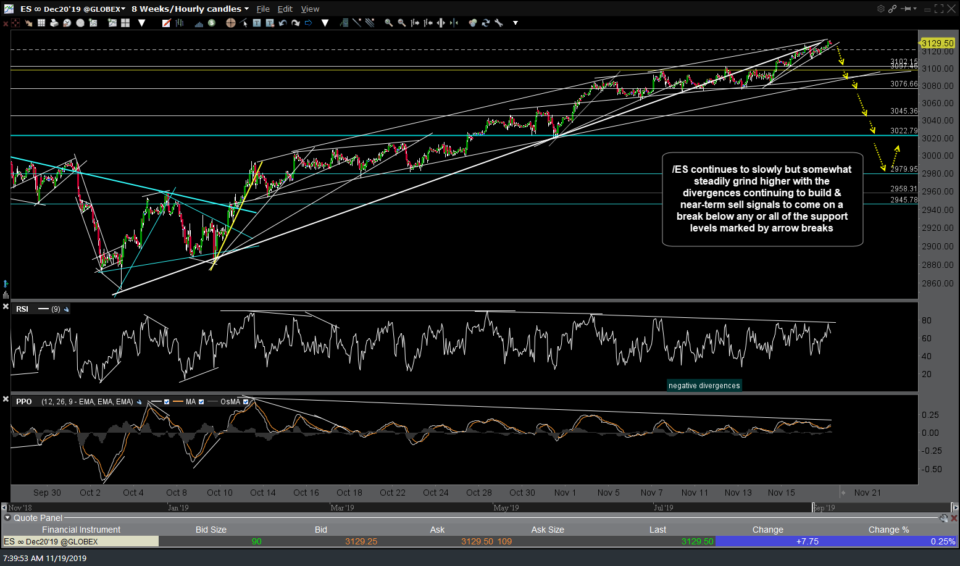
Ditto for /ES (S&P 500 futures) which also continues to slowly but somewhat steadily grind higher with the divergences continuing to build & near-term sell signals to come on a break below any or all of the support levels marked by arrow breaks.
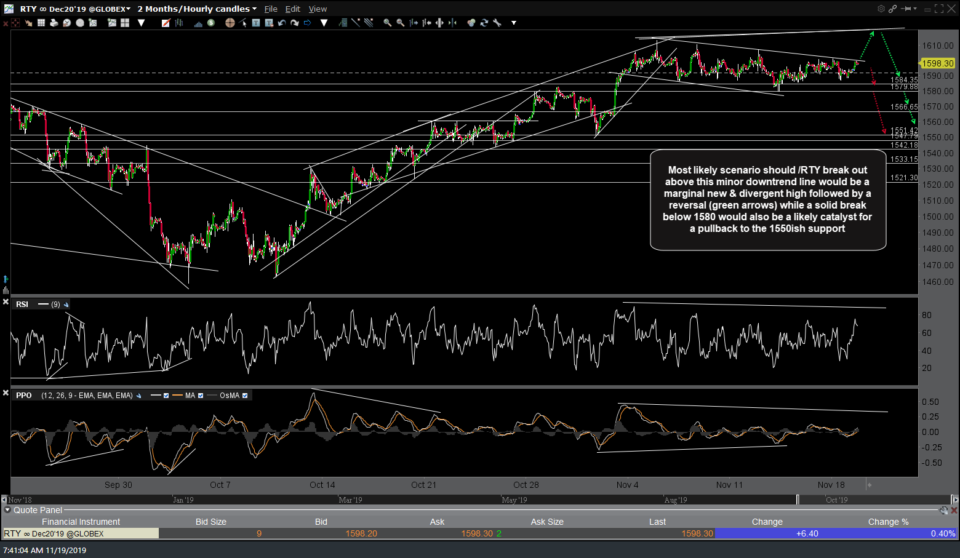
The most likely scenario should /RTY (R2k Small Cap futures) break out above this minor downtrend line would be a marginal new & divergent high followed by a reversal (green arrows) while a solid break below 1580 would also be a likely catalyst for a pullback to the 1550ish support. FWIW, I’d put coin-toss odds on either scenario & as such, I’ll continue to focus my trading away from the indexes on individual stocks, sectors, commodities, currencies, bonds, etc. with better R/R profiles until & unless we get some half-decent sell signals on the major stock indices.
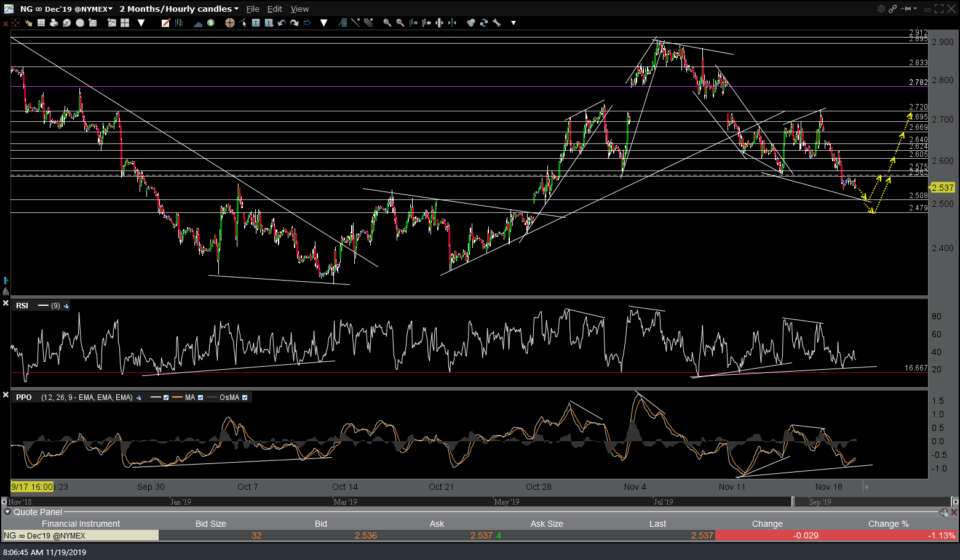
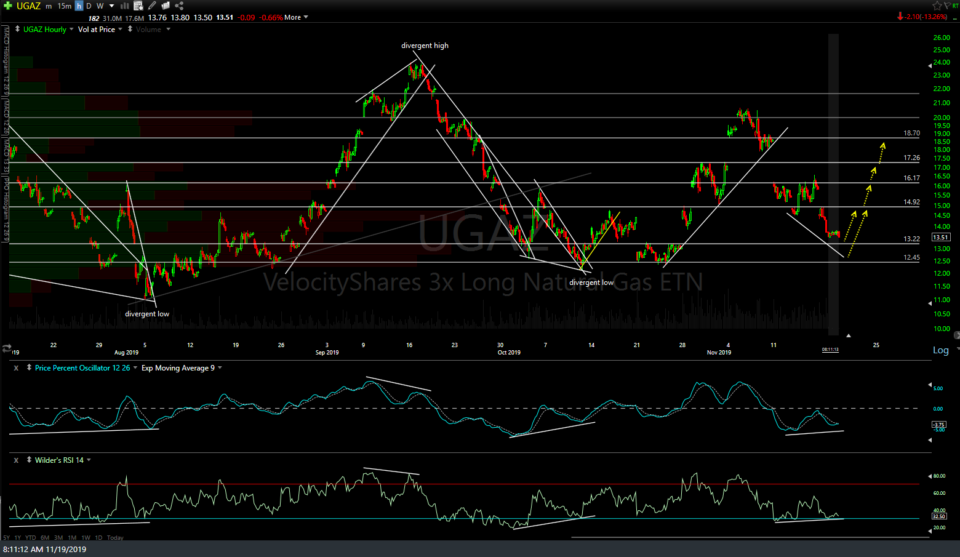
One of those potential trading opportunities on my radar is /NG (natural gas) which may soon offer the next objective long entry as it approaches the 2.50-2.48 support zone with positive divergences building after the last (unofficial) long trade hit & reversed off the 2.720 price target while putting in a divergent high.
I’ve also provided a 60-minute chart of UGAZ (3x bullish natural gas ETN) with a comparable objective buy zone (13.25ish-12.45) and potential targets (unofficial trade for now).


