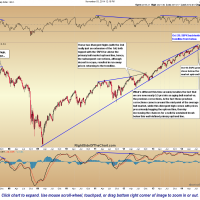
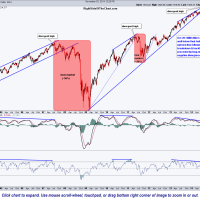
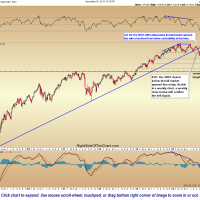
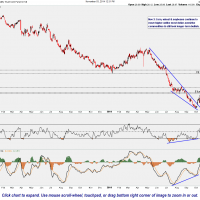
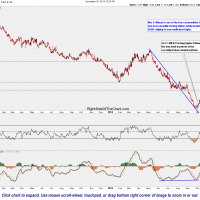
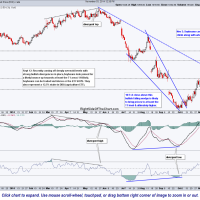
Market commentary continues to be on the light side as not much has changed since last week. Although the recent bounce in some of the US stock indices has dampened the longer-term bearish case, it has yet to eliminate it. These first three charts below are weekly charts of large caps (S&P 500 Index), MidCaps (S&P 400 MidCap Index) and Small Cap stocks (Russell 2000 Small Cap Index). Essentially, the large cap stocks have moved slightly above their primary bull market uptrend line while making a (so far) feeble attempt at new highs while both the Small & Mid Caps remain below their previous highs. Small caps (both the $RUT & the S&P 600 Small Cap Index) are currently backtesting their bull market uptrend lines from below while the Mid Caps were already rejected once on their first attempt to backtest from below & remain well below their bull market uptrend line at this time. It is also worth noting that the 20-day EMA on the S&P 500 is currently trading above the 50-day EMA for the first time since the pair triggered an intermediate-term sell signal with a bearish crossover back on Oct 8th. Although such trend indicators shouldn’t be used as exact or stand-alone buy & sell signals, should the 20-day close above the 50-day today and continue to trade above it going into the end of the week, that would further dampen the longer-term bearish case.
- $SPX weekly Nov 3rd
- $MID weekly Nov 3rd
- $RUT weekly Nov 3rd
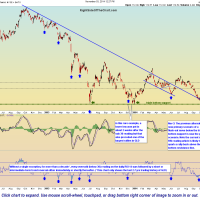
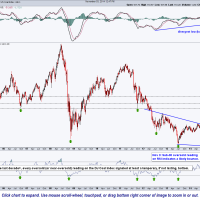
As mentioned last week, my former alternative scenario on gold became my primary scenario when gold prices dropped below the triple-bottom defined by the mid & late 2012 and early Oct 2014 lows. This current scenario was discussed in the past as a temporary break below that key support level which (assuming prices make a sustained reversal soon) would serve as a final flush-out move in gold prices, shaking out the last of the weak-handed longs and sucking in some new short sellers, which would be forced to cover, should this move prove to be a bear-trap. How long & how much further gold prices drop before reversing, assuming this scenario does pan out, is hard to say but most likely a few days to a few weeks. Adding long exposure to gold here while trading below that key triple-bottom support (now resistance) would be very aggressive & highly speculative. For longer-term traders & investors, the most prudent entry or add-on to any gold or gold mining stocks would come on a solid move back above the 114.50ish resistance level (former triple-bottom) on GLD.
Following the daily chart of GLD below are the charts of the three agricultural commodities that I’ve been highlight for the past several months, Corn, Wheat & Soybeans (etf symbols: CORN, WEAT, & SOYB). These commodities have been continually moving higher despite the US dollar breaking out to recent highs lately, a very bullish sign IMO. I continue to remain longer-term bullish on these (but not all) ag commodities as well as the select coal stocks (another commodity sector moving higher lately despite the strength in the dollar).
- GLD weekly Nov 3rd
- CORN daily Nov 3rd
- WEAT daily Nov 3rd
- $SOYB daily Nov 3rd
- $DJUSCL weekly Nov 3rd
The bottom line is that I remain longer-term bearish US equities while bullish select commodities, including gold, silver & the mining sector. However, the recent sharp rally in equities followed by Friday’s break of key support in gold has put me on the sidelines for now as the near-term outlook has become somewhat obscure. I will continue to sit tight waiting for some decent evidence of a bearish reversal in stocks as well as waiting for a bullish reversal in gold (back above the former triple-bottom support) before adding any new exposure (short equities or long metals/miners).


