I am far from a proficient “Elliotician” so I’d welcome feedback on those who regularly incorporate Elliot Wave Theory into their market analysis as to whether or not the wave counts for these potential Ending Diagonal Patterns are valid (or might be but could use some relabeling). I have mentioned the possibly of an ED Pattern on the S&P 500 Index in recent weeks but have also noticed similar formations on some other key indices such as the Wilshire 5000 Index & the S&P 400 Mid Cap Index (click on any of those indices to view the live charts). If these formations are indeed valid ED pattern, prices would have to turn down very soon. One thing to note is that overshoots of the wedge on the final thrust higher is not uncommon so a blow-off top over the next week or so is certainly a possibility.
-
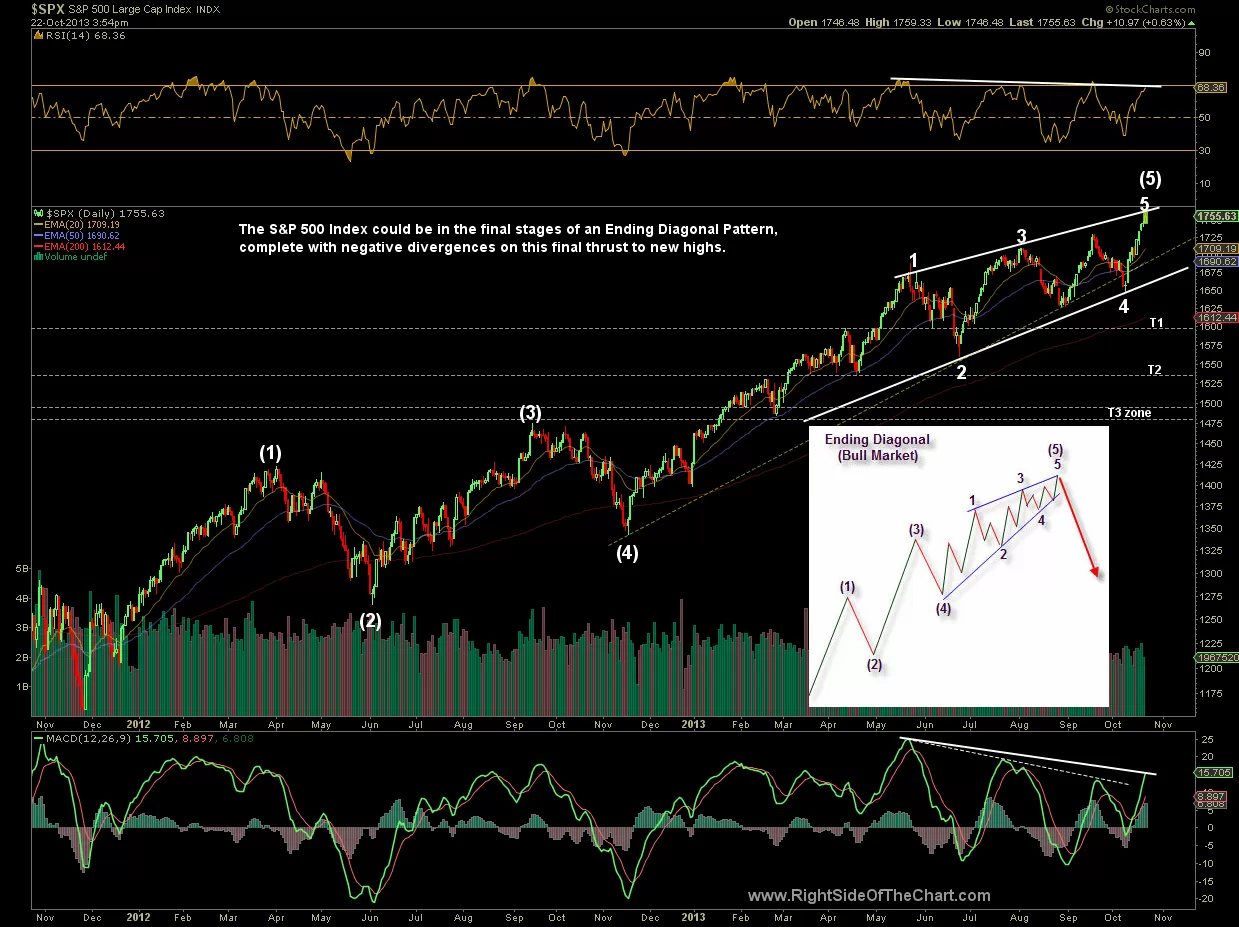
- S&P 500 Index
-
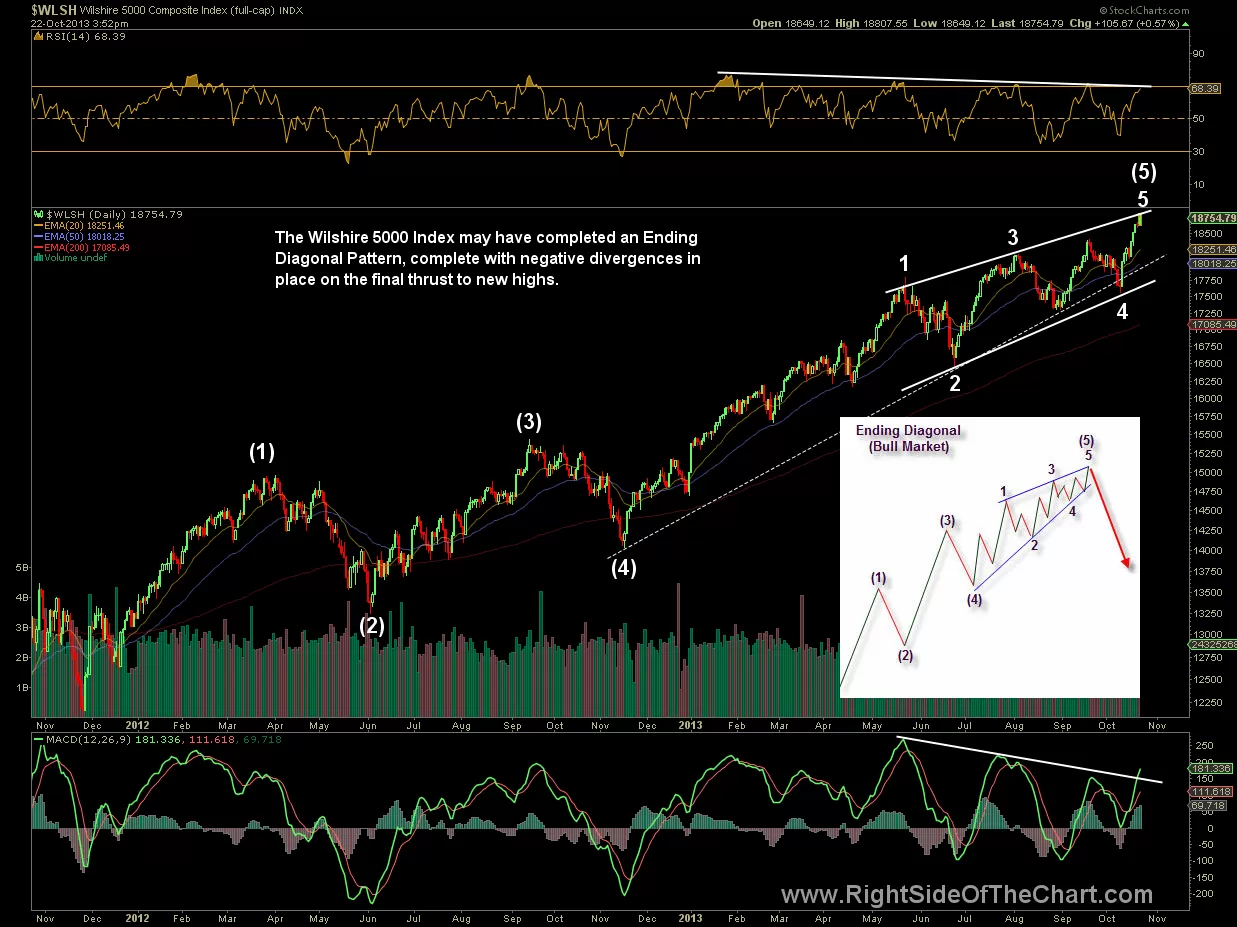
- Wilshire 5000 Index
-

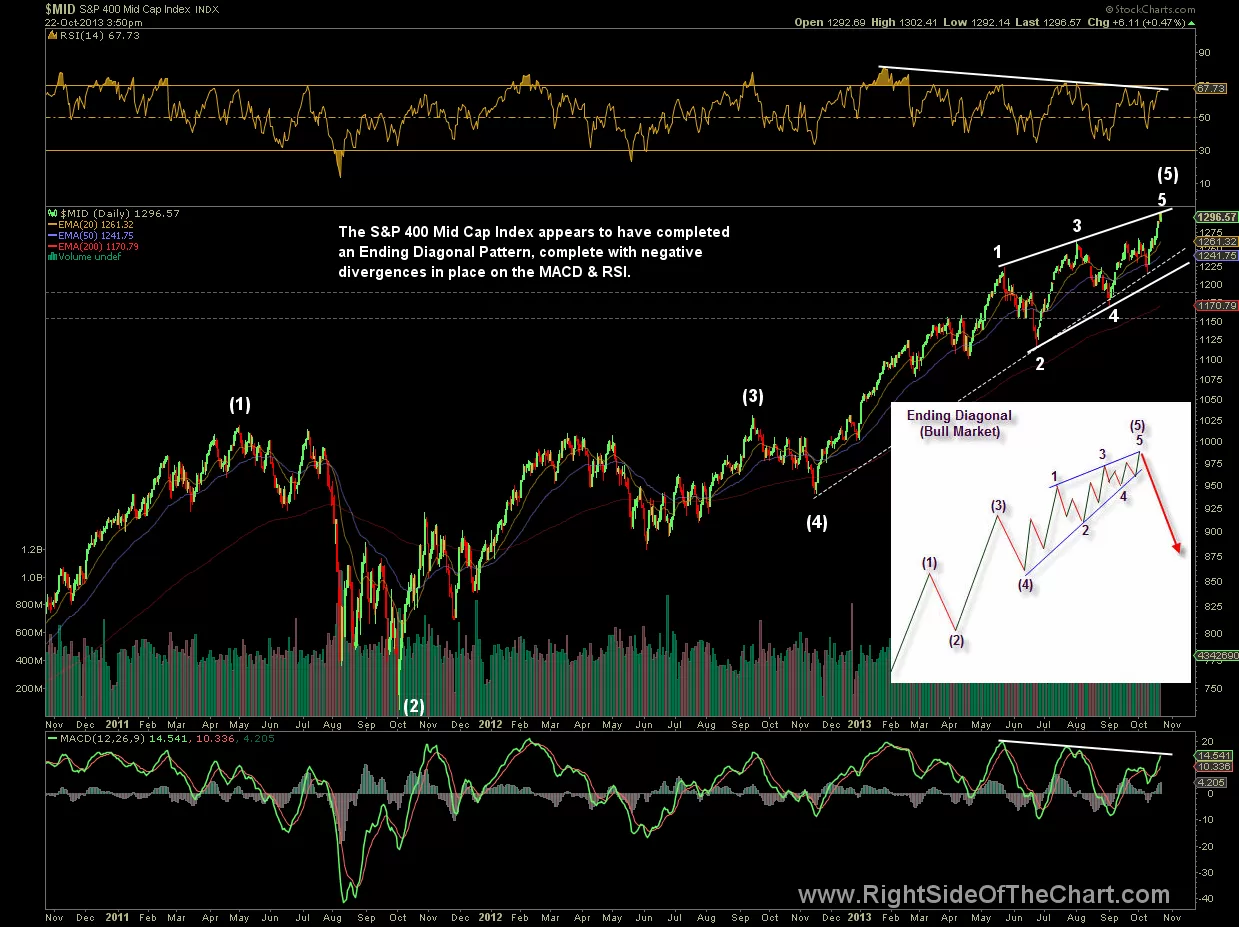
- S&P 400 Mid Cap Index