
Positive divergences on this /GC (gold futures) 60-minute chart could be the catalyst for a rally & reversal just above the 1850ish support zone. Otherwise, one more thrust down to that support zone with the divergences still intact would provide an objective time to cover a short and/or go long. Personally, I covered my gold & silver shorts because of this & will look to possibly re-enter soon, ideally on a bounce back to resistance.
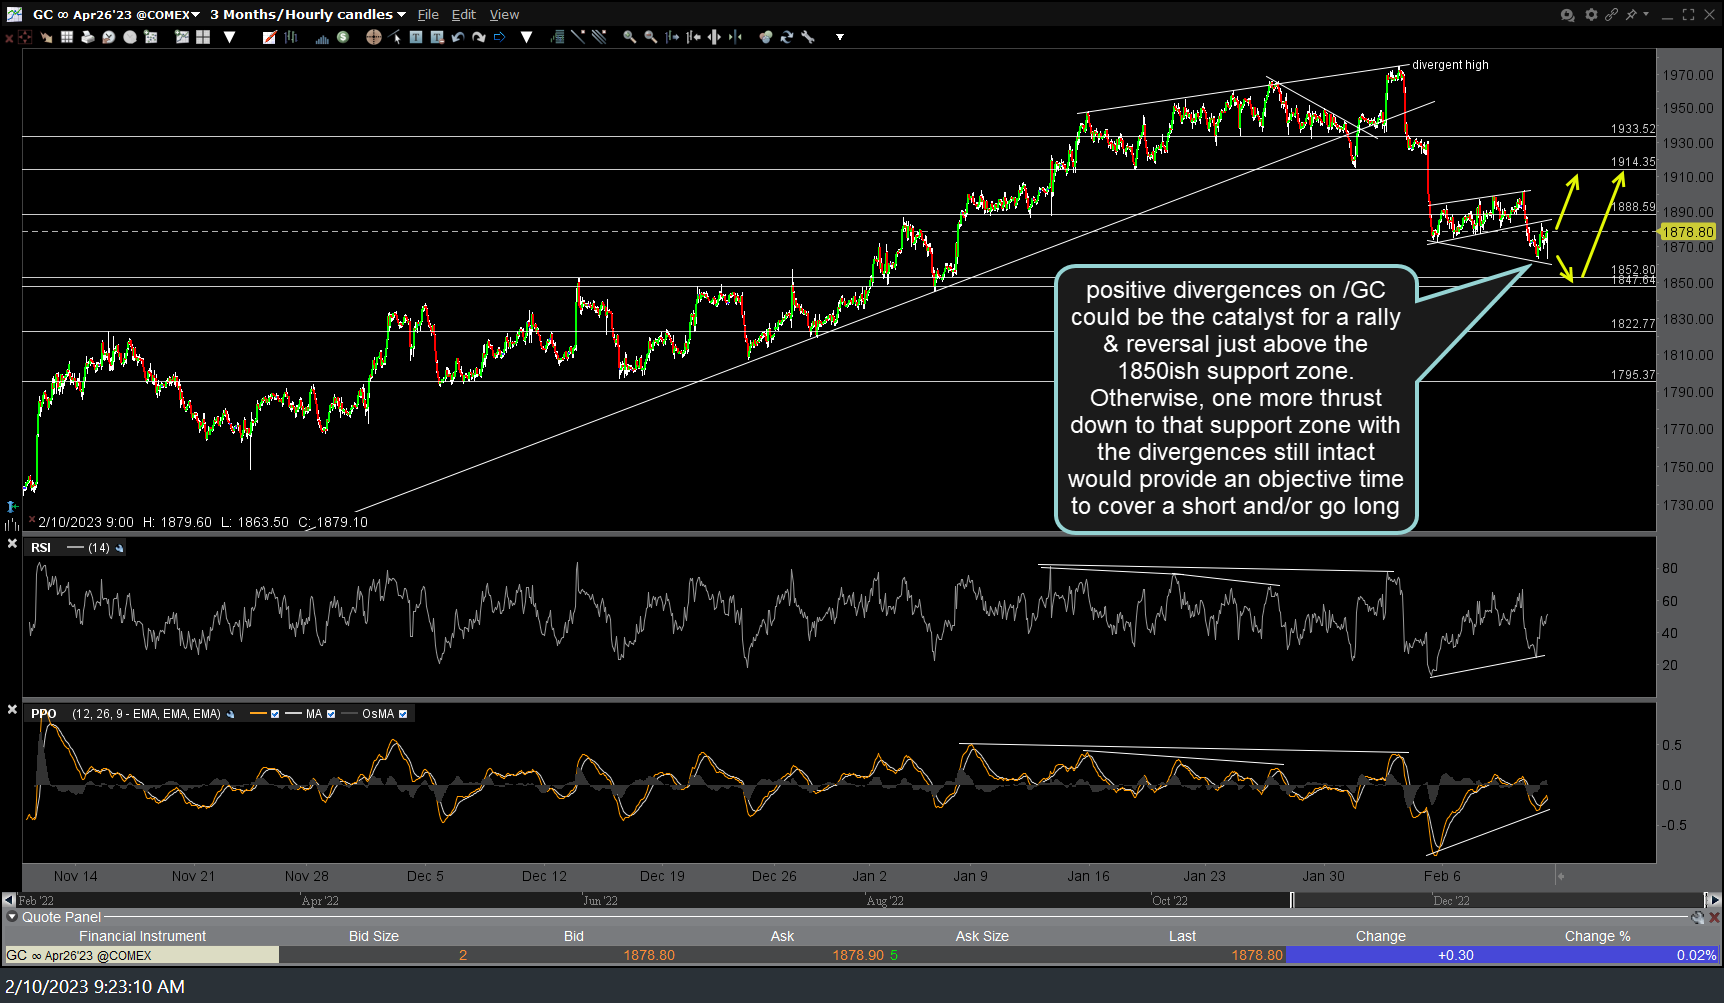
GC 60m Feb 10th
Likewise, bullish divergences along with a breakout above the downtrend line/wedge on this 60-minute chart of /SI (silver futures) could be the catalyst for a rally. A decent case for more downside in the metals & miners can still be made from the daily charts of the metals, US Dollar, & Euro but I put a pretty heavy weighting on clean positive divergences on the 60-minute charts, especially when something (such as gold & silver, in this case) are in correction mode within a larger uptrend.
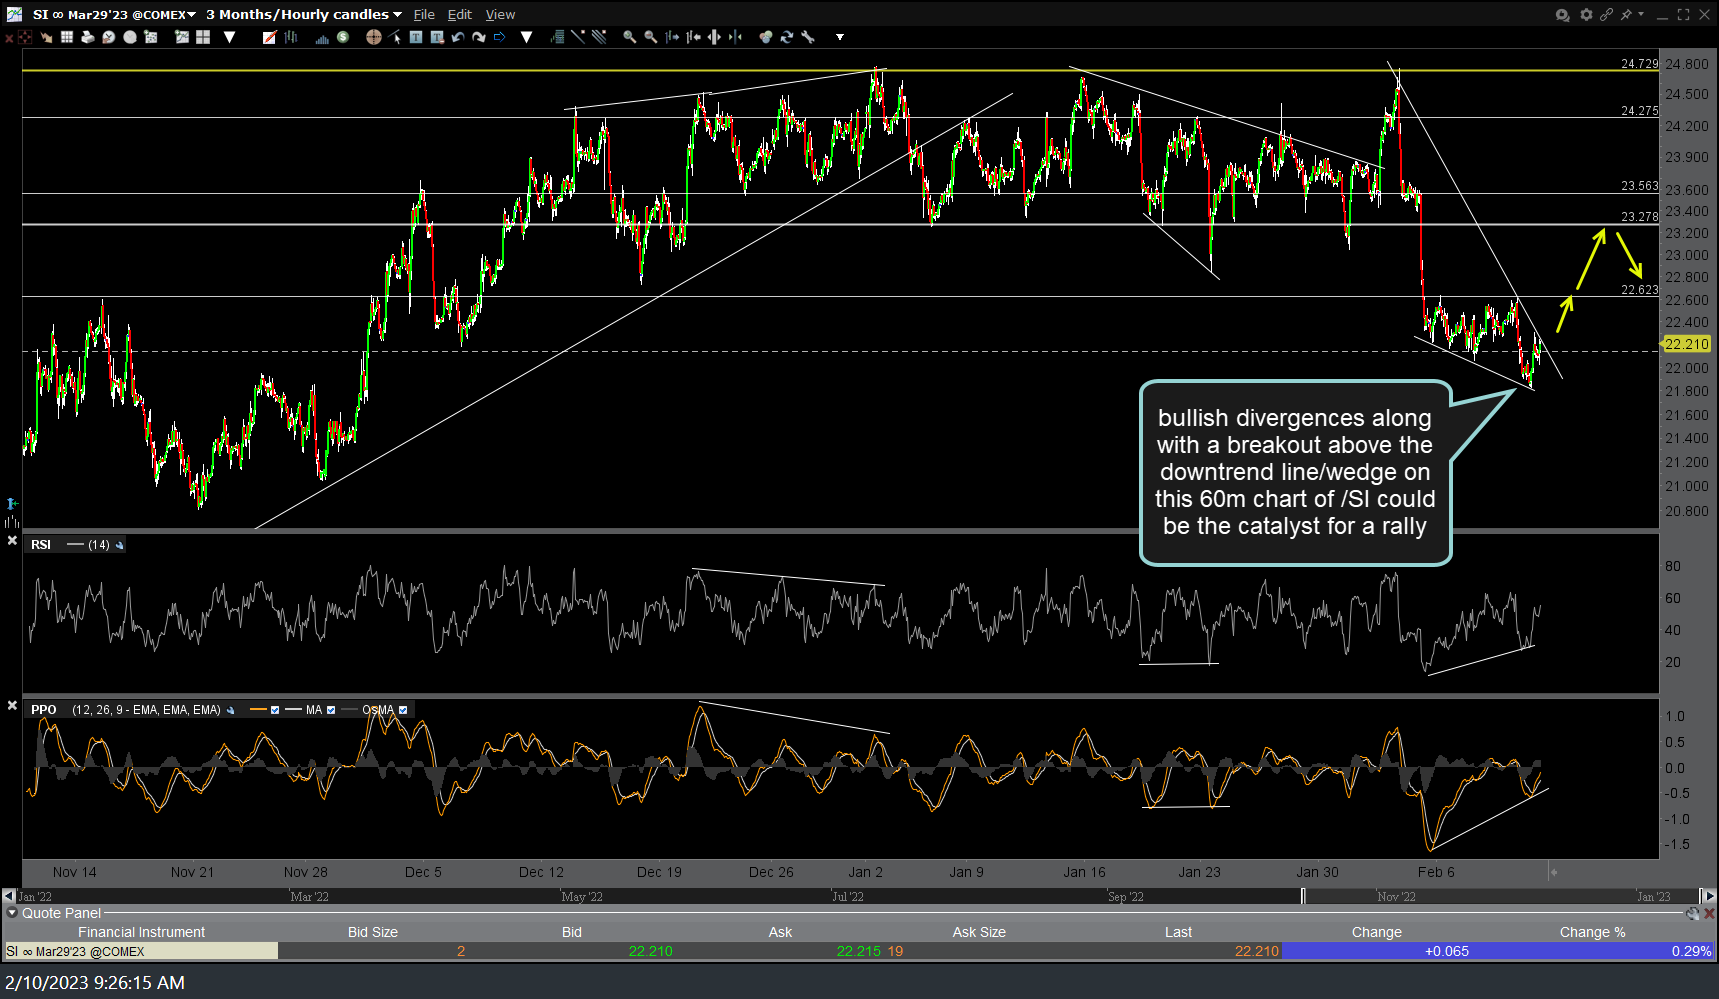
SI 60m Feb 10th