
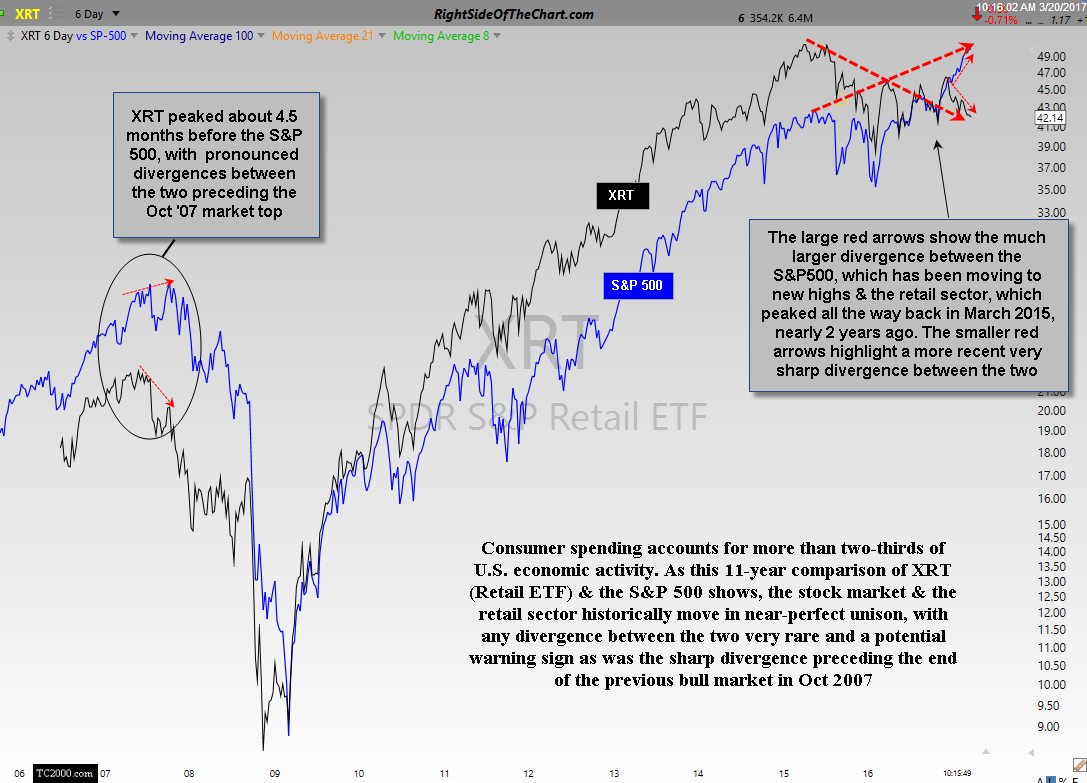
Consumer spending accounts for more than two-thirds of U.S. economic activity. As this 11-year comparison of XRT (SPDR S&P Retail ETF) vs, the S&P 500 shows, the stock market & the retail sector historically move in near-perfect unison, with any divergence between the two very rare and a potential warning sign as was the sharp divergence preceding the end of the previous bull market in Oct 2007.
XRT vs. SPX March 20th
Back in 2007, XRT peaked about 4.5 months before the S&P 500, with pronounced divergences between the two preceding the Oct ’07 market top. This time around the divergences are much more pronounced with XRT having peaked all the way back on March 31, 2015, still trading about 18% below that peak nearly 2 years ago while the S&P 500 powers on to new highs.
Taking a closer look at the price action of the stock market & retail sector over the last two years, we can see that when XRT peaked back in March 2015, the S&P 500 continue to rise & then flatten out for a few months before the largest correction in years, with the S&P 500 falling about 15%. Immediately following that correction, which was once again foreshadowed by the divergence between the two, you can see that the retail sector rallied along with the broad market (off the Feb ’16 lows), with the historical positive correlation once again restored… until recently that is, with an extremely sharp divergence between the two over the last 3½ months (highlighted with the smaller red arrows).