
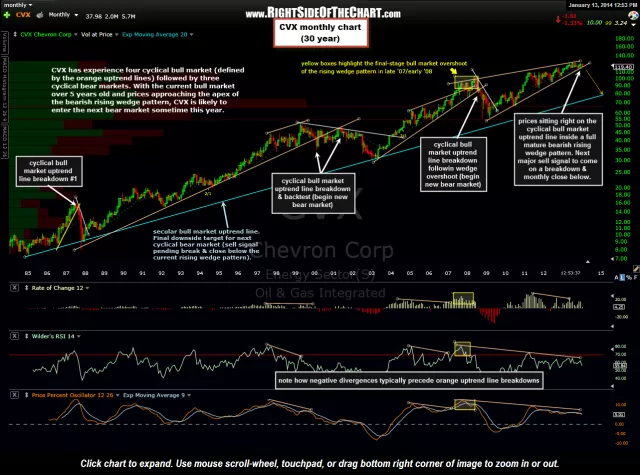
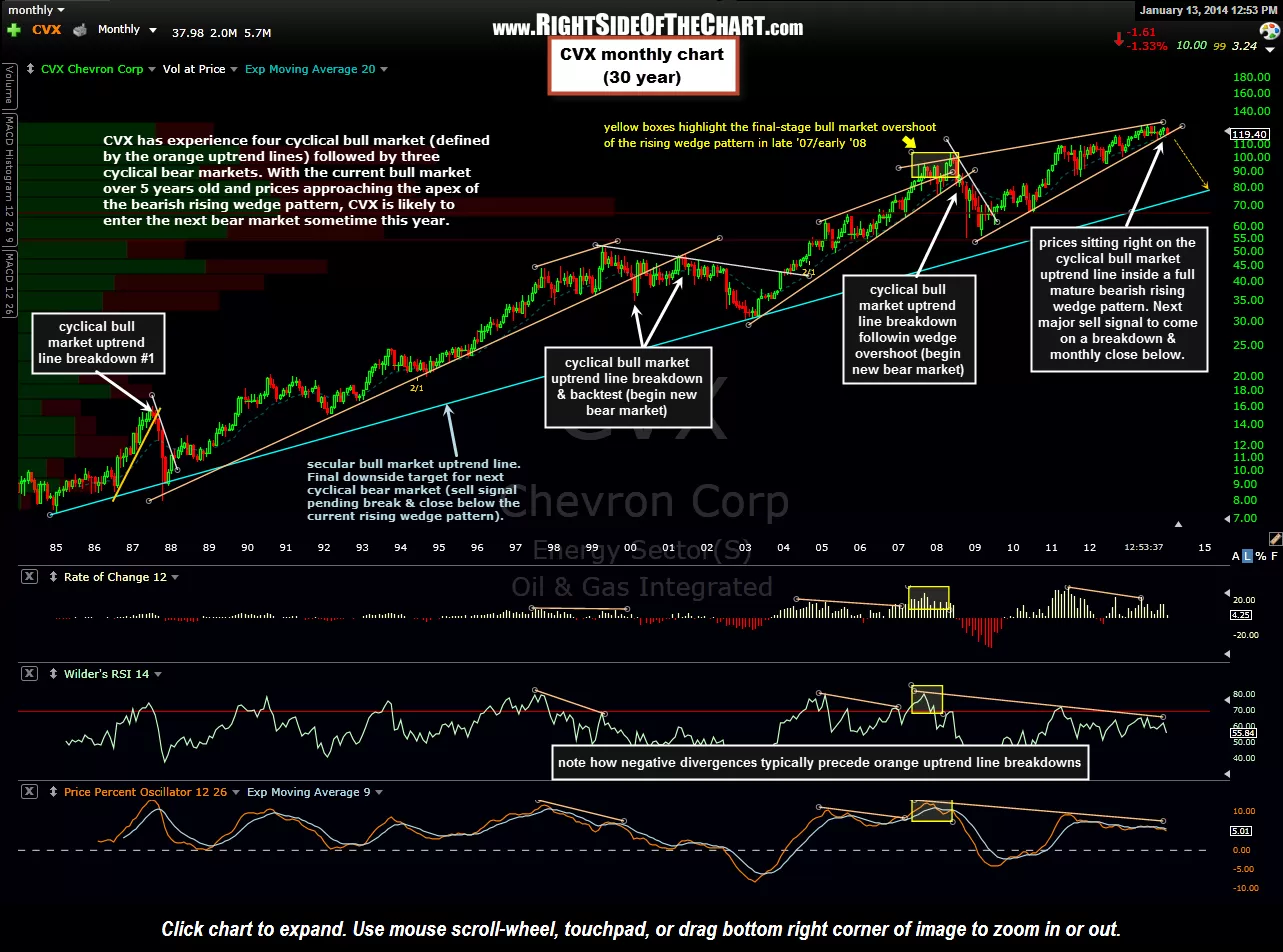
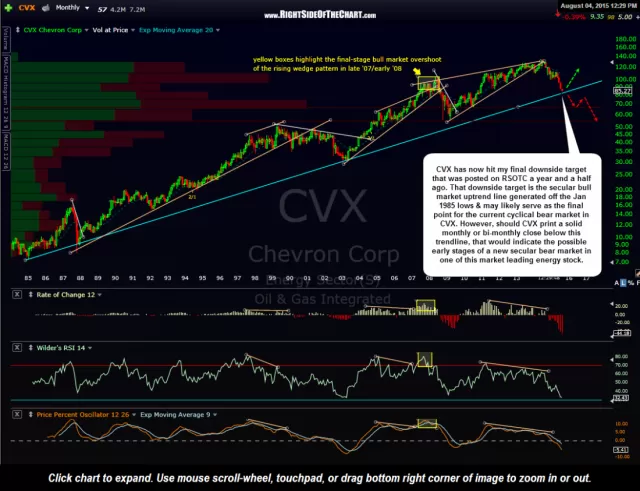
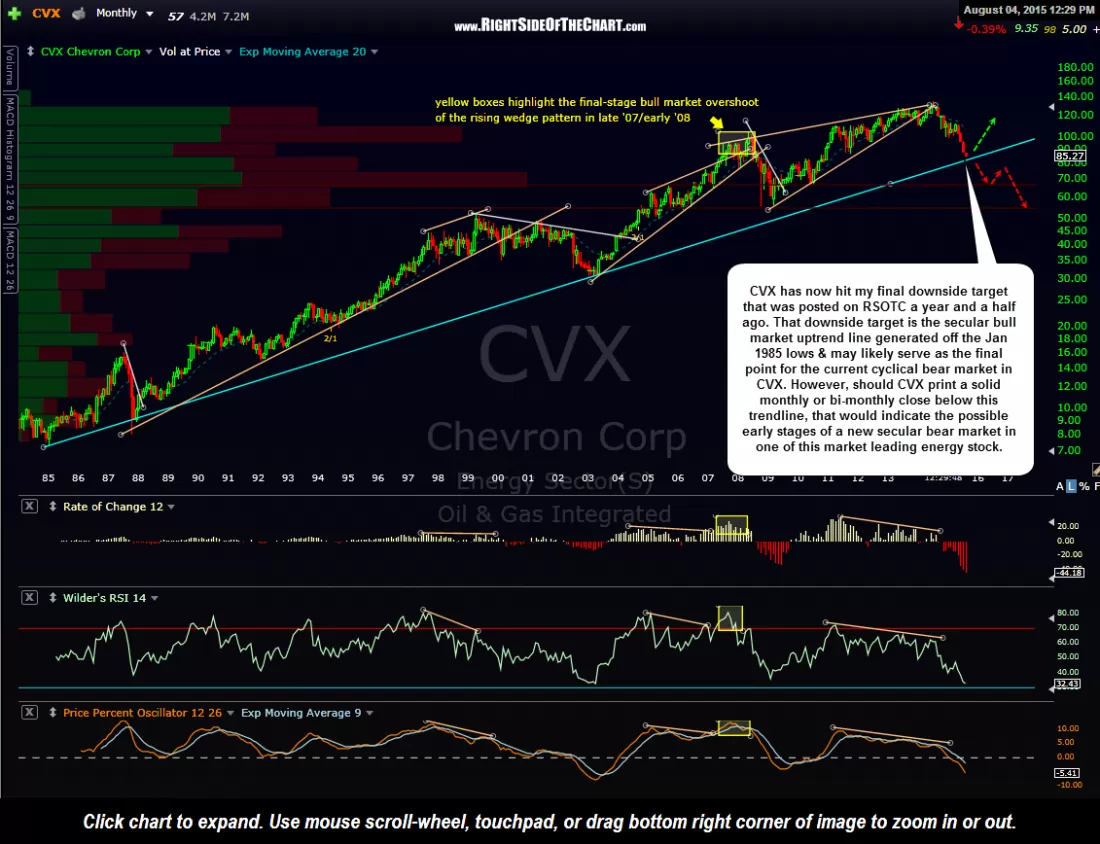
CVX (Chevron Corp.) has now hit my final downside target that was posted here a just over a year and a half ago. In that post back in January of 2014, I stated that “the case has been made that the current cyclical bull market in CVX, which began with the Oct 2008 bottom in the stock, is approaching its final stages and that the next bear market in the mega-cap energy company will likely come on a break & close below this latest bearish rising wedge pattern (on the monthly chart). My ultimate downside target remains the 24-year old secular bull market uptrend line generated off the Jan 1985 lows in XOM, a trendline that has not been visited by the stock in nearly 11 years.”
-
- CVX Month Jan 13th
-
- CVX monthly August 4th
Here’s a look at the 32 year, monthly chart that was posted back then along with the updated monthly chart of CVX. Being this is a monthly chart, that means that although CVX is likely to find support on this first tag of that trendline in over 12 years, this is far from an exact timing indicator for a long entry in CVX. When trading (or in this case, investing or trend positioning) off the monthly charts, all that matters are the end-of-month closing values (as that is when each candlestick is finalized). We can, however, use the weekly, daily & even intraday time frames in order to help hone down an entry in CVX, whether it be for just a bounce trade (most likely lasting several weeks or months in this case) or positioning for a longer-term trade/investment in CVX.
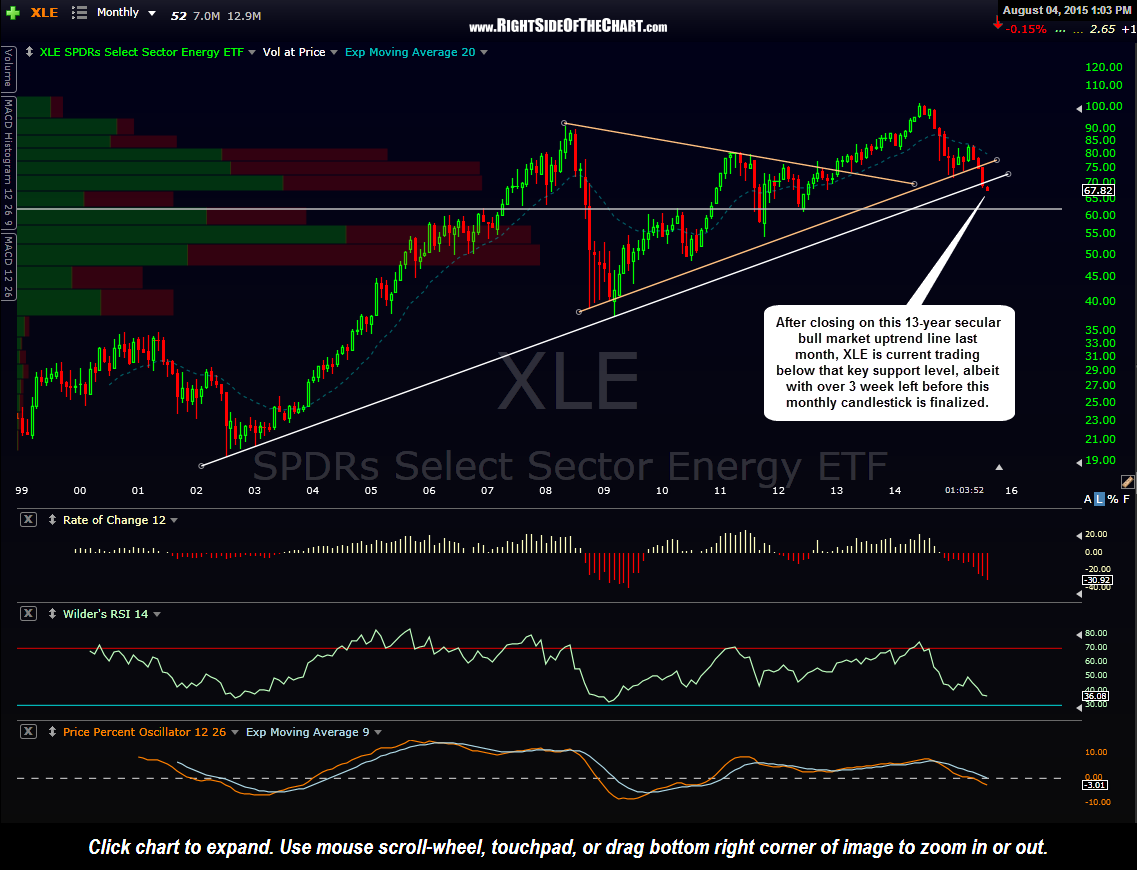
XLE monthly August 4th
Currently, I see a mixed bag of technicals on CVX as well as many other key energy stocks. Regarding CVX, I can’t make a strong enough case to go long at this point based on weekly & daily charts. I’ve also recently pointed out the fact that XLE had also fallen to its 13-year secular bull market uptrend line although prices are now trading below that key support level, although we are only 4 calendar days into the trading month & so a close back above that uptrend line by the end of August is still very much a possibility. I am also very open to the possibility that should CVX print a solid monthly or multiple consecutive monthly closes below this trendline, that could indicate that a new secular bear market is underway in this market leading energy stock and quite likely, the energy sector as a whole. With that being said, I continue to monitor both crude oil as well as the energy sector very closely for any above average risk/reward trading opportunities and will continue to post any significant technical developments as they occur.