
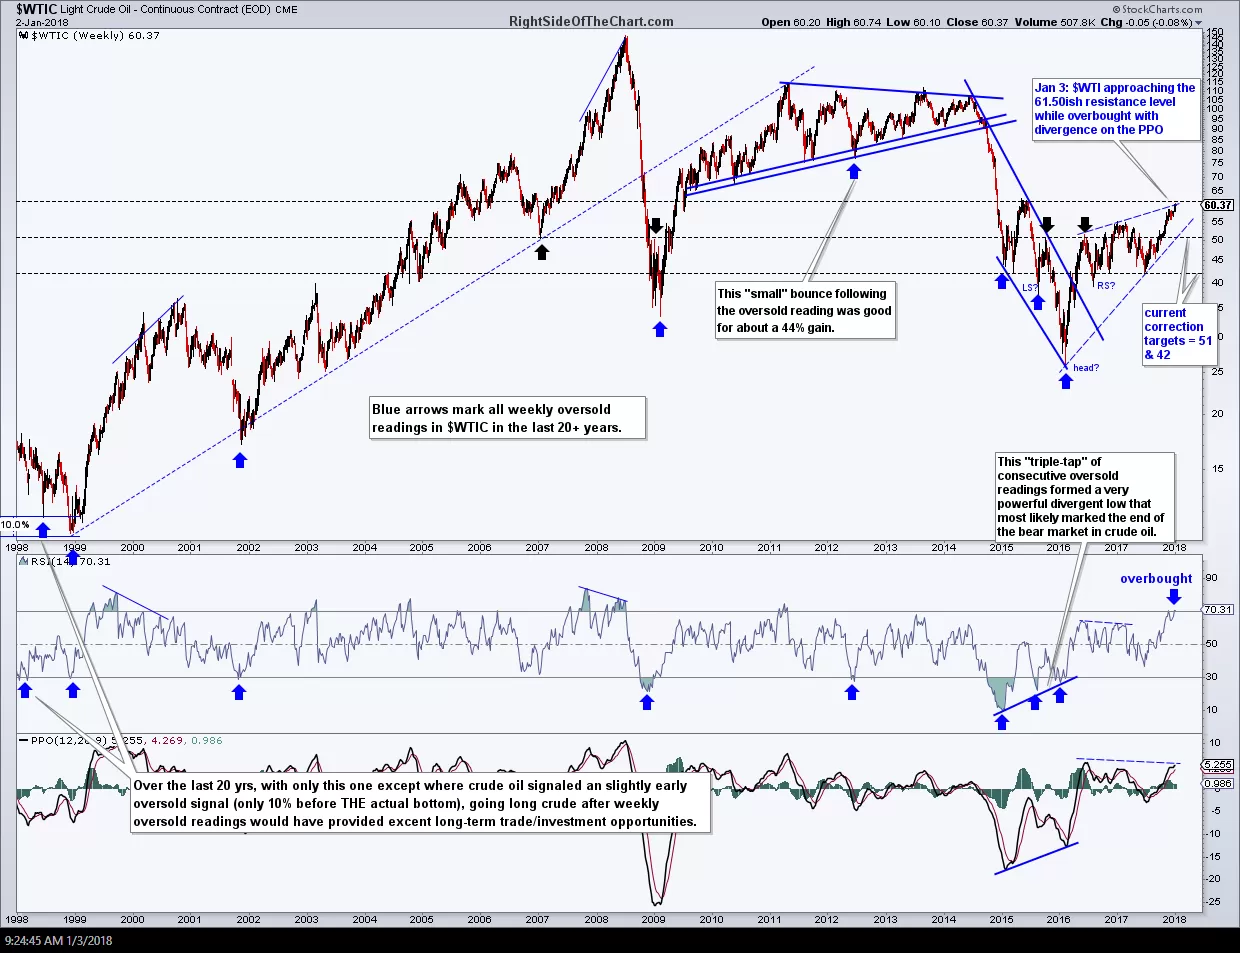
Following a strong advance off the June lows, crude oil now appears poised for a correction with limited upside as $WTIC is approaching the 61.50ish resistance level while overbought with negative divergences on both the daily & weekly time frames. A sell signal will come on a break below the bearish rising wedge pattern on the daily chart below although I will also be watching for any early indications of a potential top in crude, such as a bearish candlestick reversal pattern, a buying climax, etc..
-
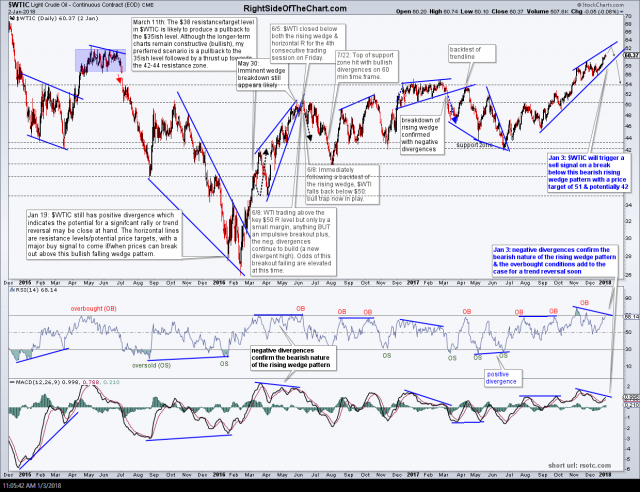
- $WTIC daily Jan 2nd

-
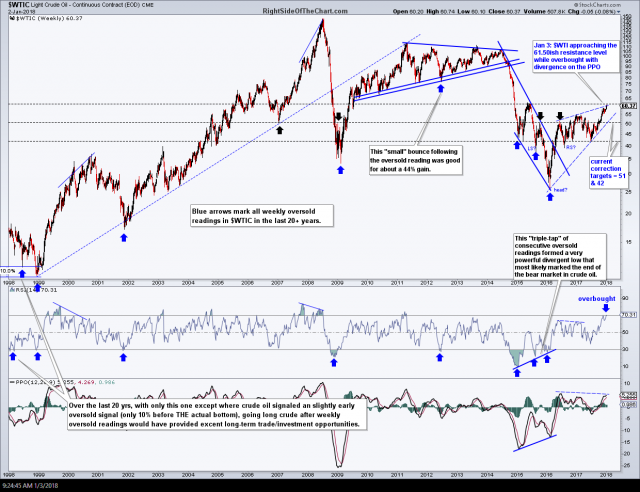
- $WTIC weekly Jan 2nd close
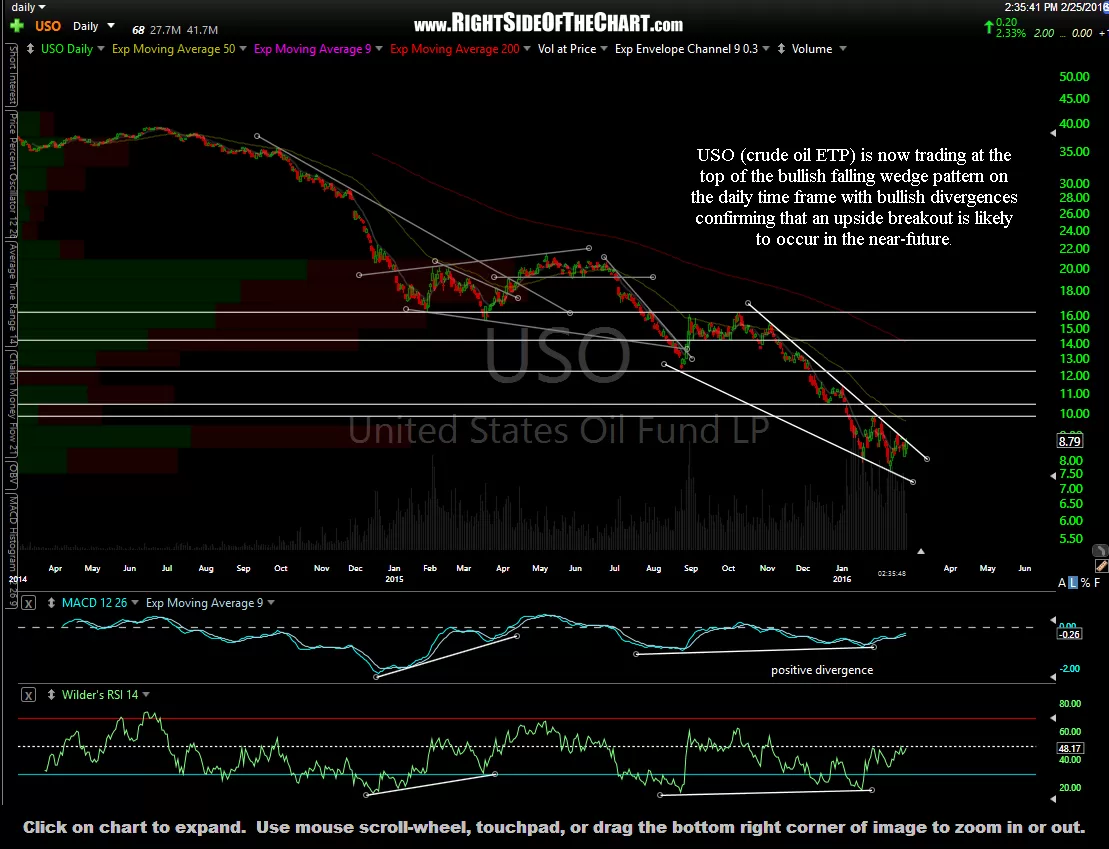
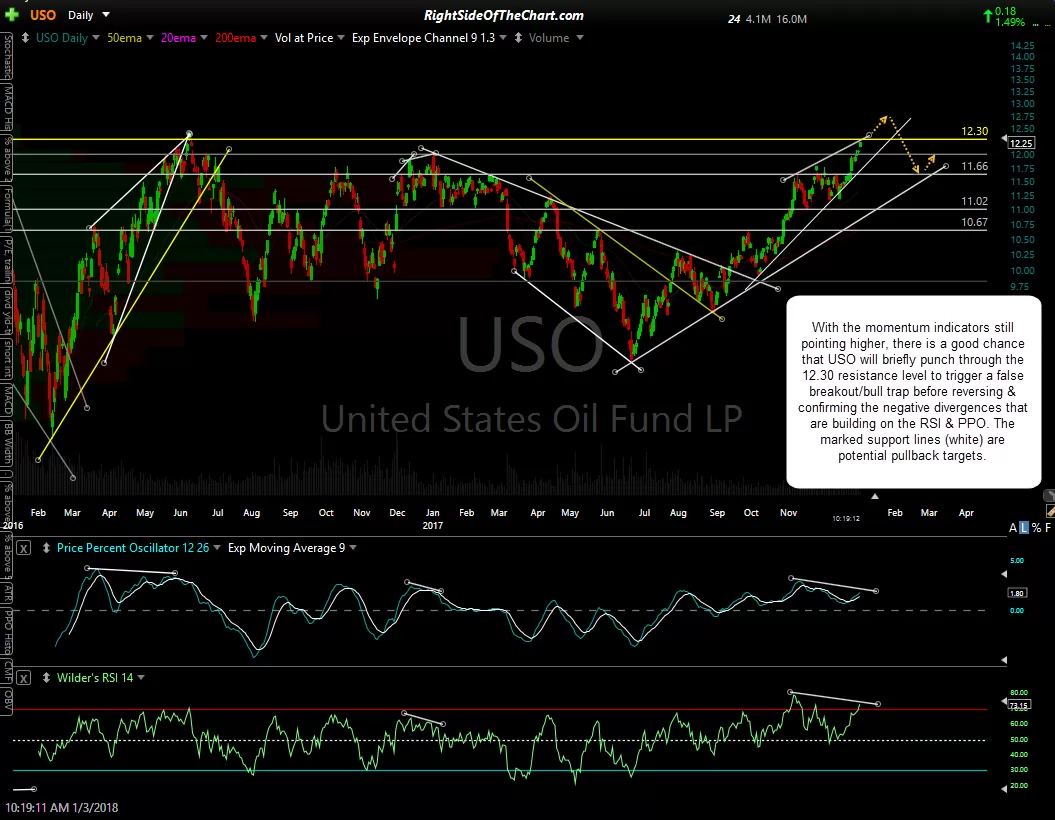
Should we get any of the aforementioned sell signals in crude soon, my price targets would be the 51 area & quite possibly the 42 area, depending on how the charts develop going forward. For those preferring to trade USO (crude oil ETN), with the momentum indicators still pointing higher, there is a good chance that USO will briefly punch through the 12.30 resistance level to trigger a false breakout/bull trap before reversing & confirming the negative divergences that are building on the RSI & PPO. The marked support lines (white) are potential pullback targets. Essentially, we have a bearish rising wedge pattern, confirmed with negative divergences with overbought conditions on USO… a near mirror image of the daily chart in USO that was posted here back when crude bottomed in February of 2016 with a bullish falling wedge confirmed with positive divergences & oversold readings on the RSI (first chart below).
-
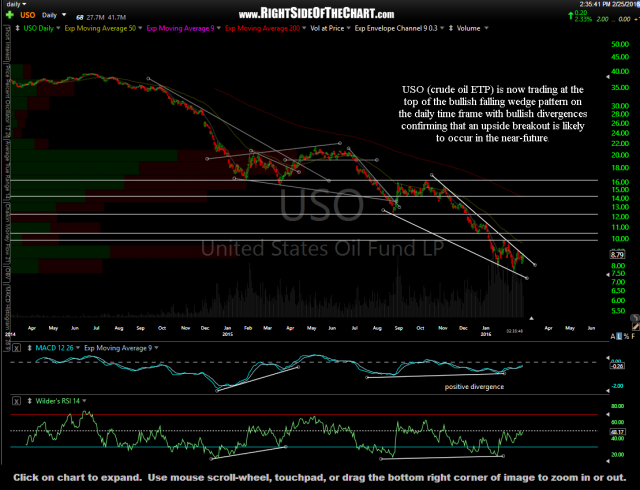
- USO daily Feb 25th
-
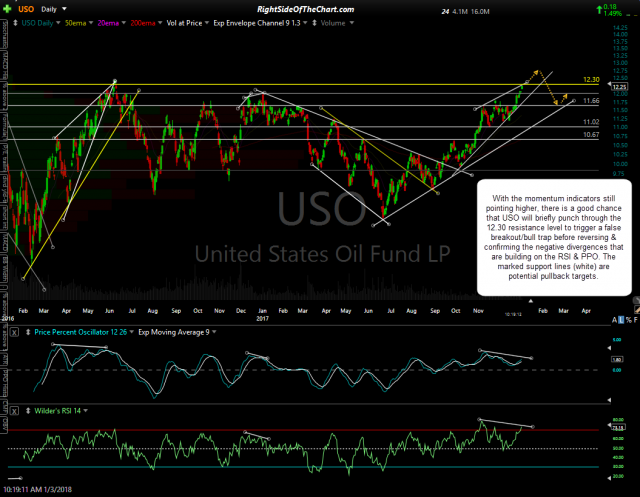
- USO daily Jan 3rd
Just to reiterate, we do not have any sell signals in crude yet & the current trend is still clearly bullish. However, the upside potential before a meaningful correction appears limited at this time as an such, the R/R to a long position in both crude oil as well as the crude related stocks is starting to diminish at this point.