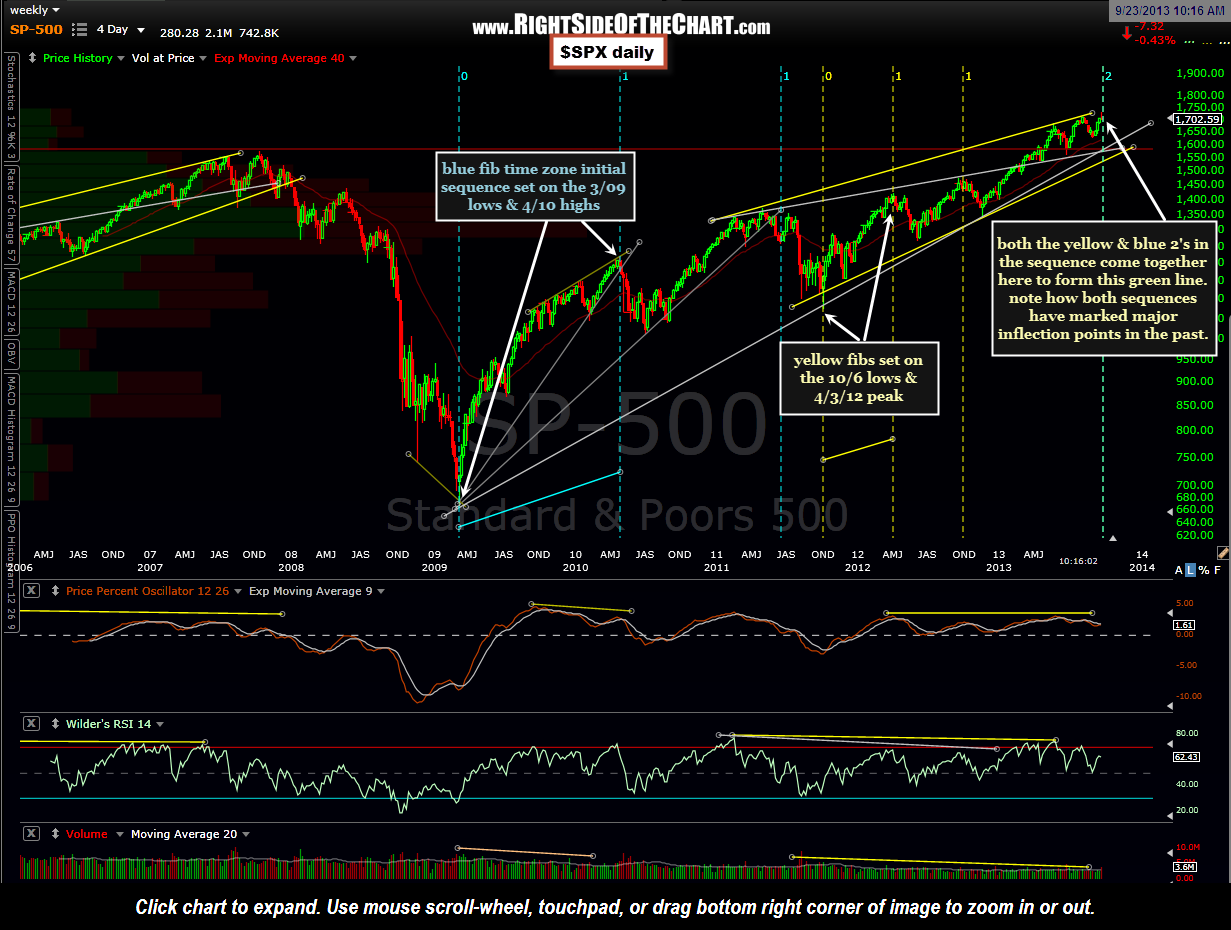
Well, apparently fibs from our gov’t officials can’t stop a rally, as they tend of have the opposite effect of juicing the market. However, it will be interesting to see if a sequence of numbers made famous by a 13 century mathematician can actually do the trick. Here’s a weekly chart of the S&P 500 that I played around with over the weekend by overlaying Fibonacci time zones (aka- “Fibs”) on a few of the major inflection points since the current bull market kicked off back in March 2009. Like anything else in trading, Fibonacci retracements, extenstions and time zones seem to work very well at times and not so well at others. Like most indicators that I employ in my analysis, I find Fibonacci levels most useful when confirmed or aligned with other metrics or indicators. My preference is to also identify fib “clusters”, where one or more set of Fib sequences come together in close proximity.
As of today, the $SPX has broken below the white minor uptrend line pointed out on the daily chart posted here last Wednesday. That followed Friday’s bearish reversal/wipe-out of the entire post-Fed rally, which also brought prices back within the purple rising wedge/possible ending diagonal pattern. That reversal put in place an over-shoot of the pattern, a technical event that often precedes a break of the pattern in the opposite direction (downward, in this case). Again, these are just some things to note as possible early signs of a trend reversal. For now, the trends on all but the shortest time-frames remain bullish but with longer-term divergences still in place on the charts coupled with these (and some other) more recent bearish technical events, I continue to believe that the risk to reward on the long-side, especially establishing new positions at this point, remains unfavorable. There are still plenty of short trade ideas offering objective entries although shorts are counter-trend trades at this time and therefore, should only be considered by aggressive traders or those looking to hedge some long exposure. Keep in mind, though, that stocks (including the broad market) typically fall much faster that they rise. It is not uncommon to see weeks and even months of gains wiped out in mere days during a correction. As such, more experience traders who are comfortable with shorting should have both a strategy (where & when to short) and a wish-list (what to short) ready to go. Those not comfortable with shorting stocks or etfs might consider booking some profits and/or tightening stops on their remaining long positions at this time.

