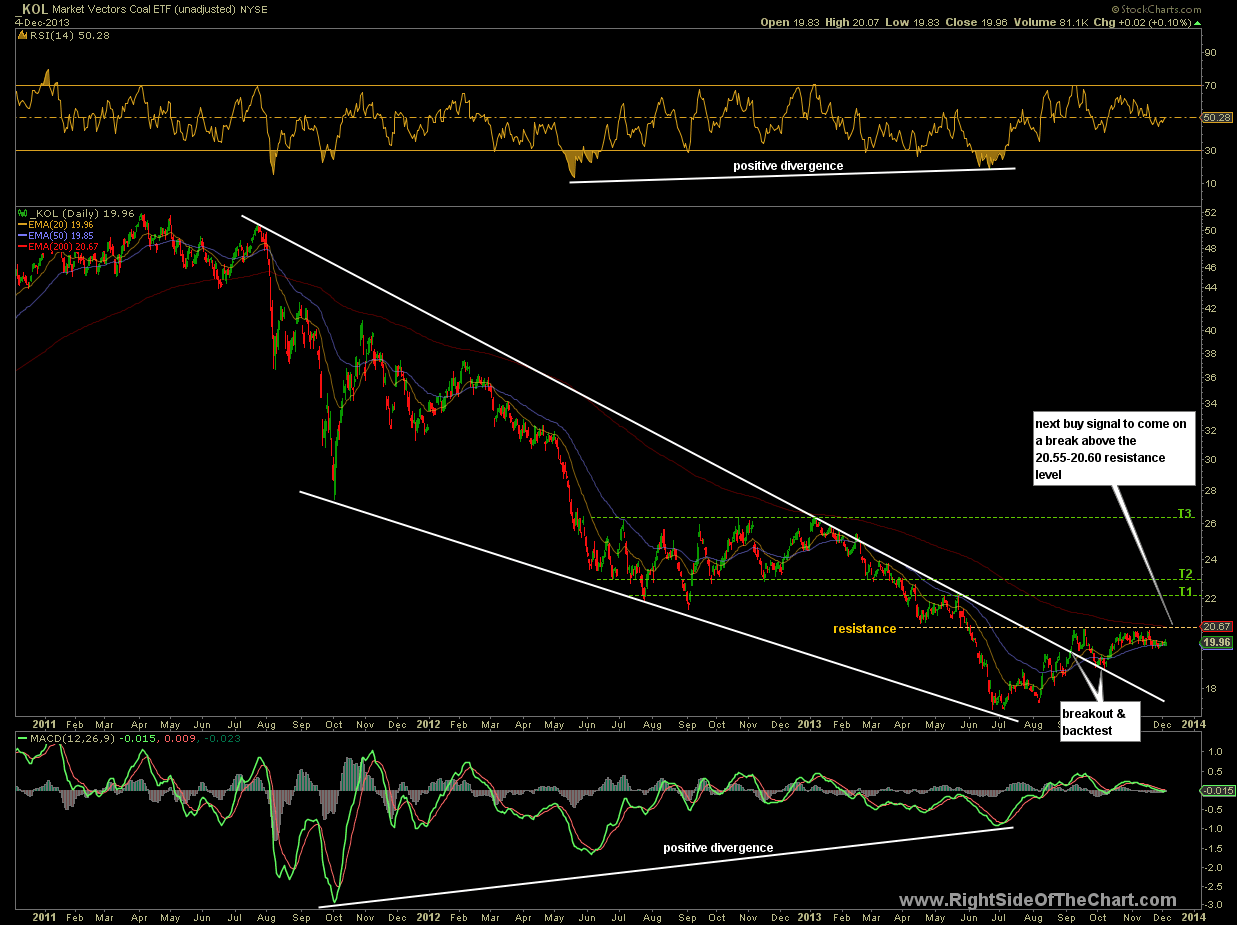
I just wanted to highlight a few commodities that look interesting here, all of which were discussed under separate posts within the last month or so. The first chart below is KOL (Market Vectors Coal ETF). KOL is currently an Active Trade but may soon offer another objective entry or add-on to an existing position on a break above the previously highlighted resistance level, which also comes in around the 200 day ema. Any solid break above that level would likely be the catalyst for a move to the first target level around 22.00.
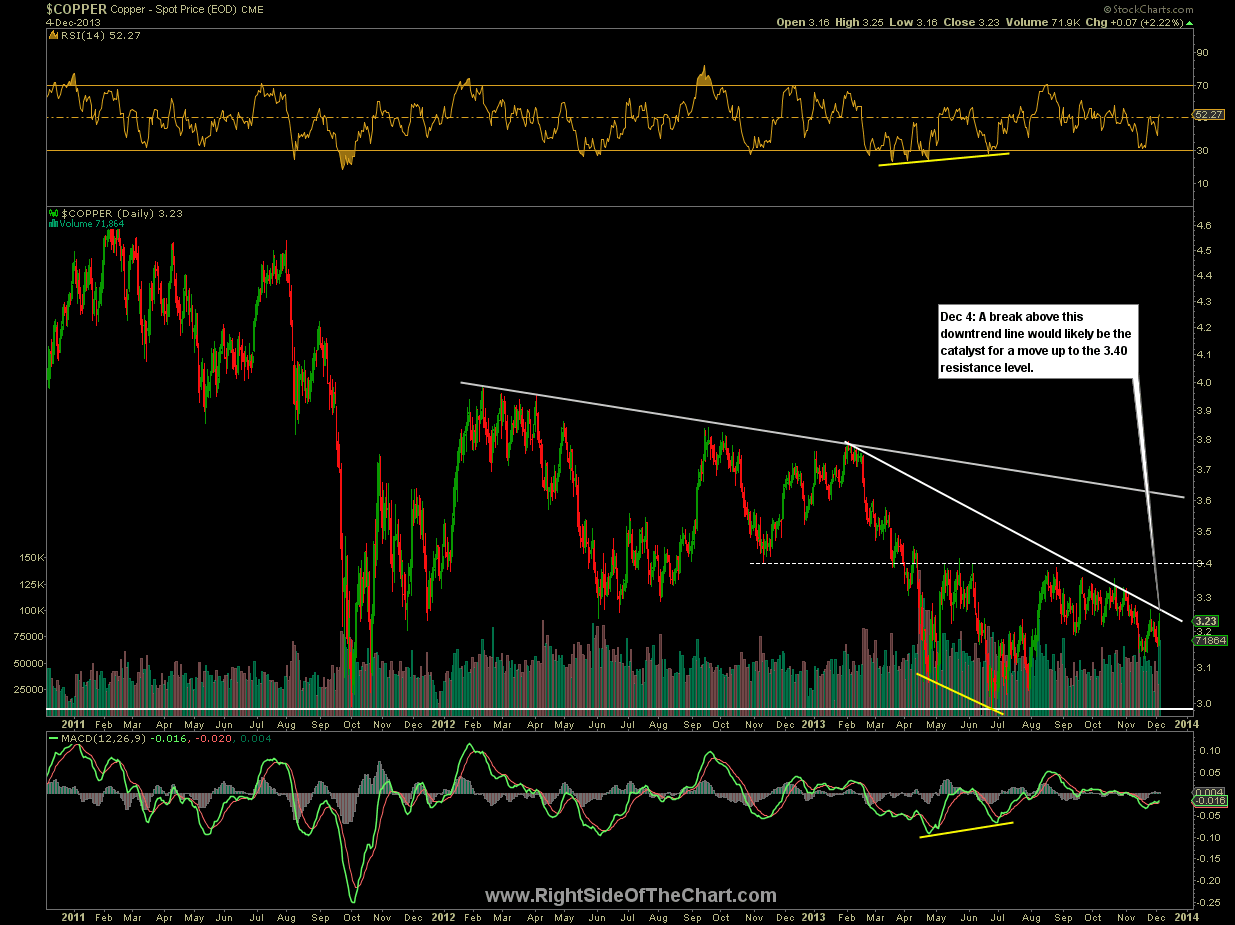
Copper is also poised for a potential breakout as any solid move above this downtrend line would likely thrust prices to the 3.40 level. Other than Copper futures contracts, one could use JJC (a copper index tracking ETF) as a proxy for trading a breakout in the metal. If so, the $22.00 area would be a comparable first price target.
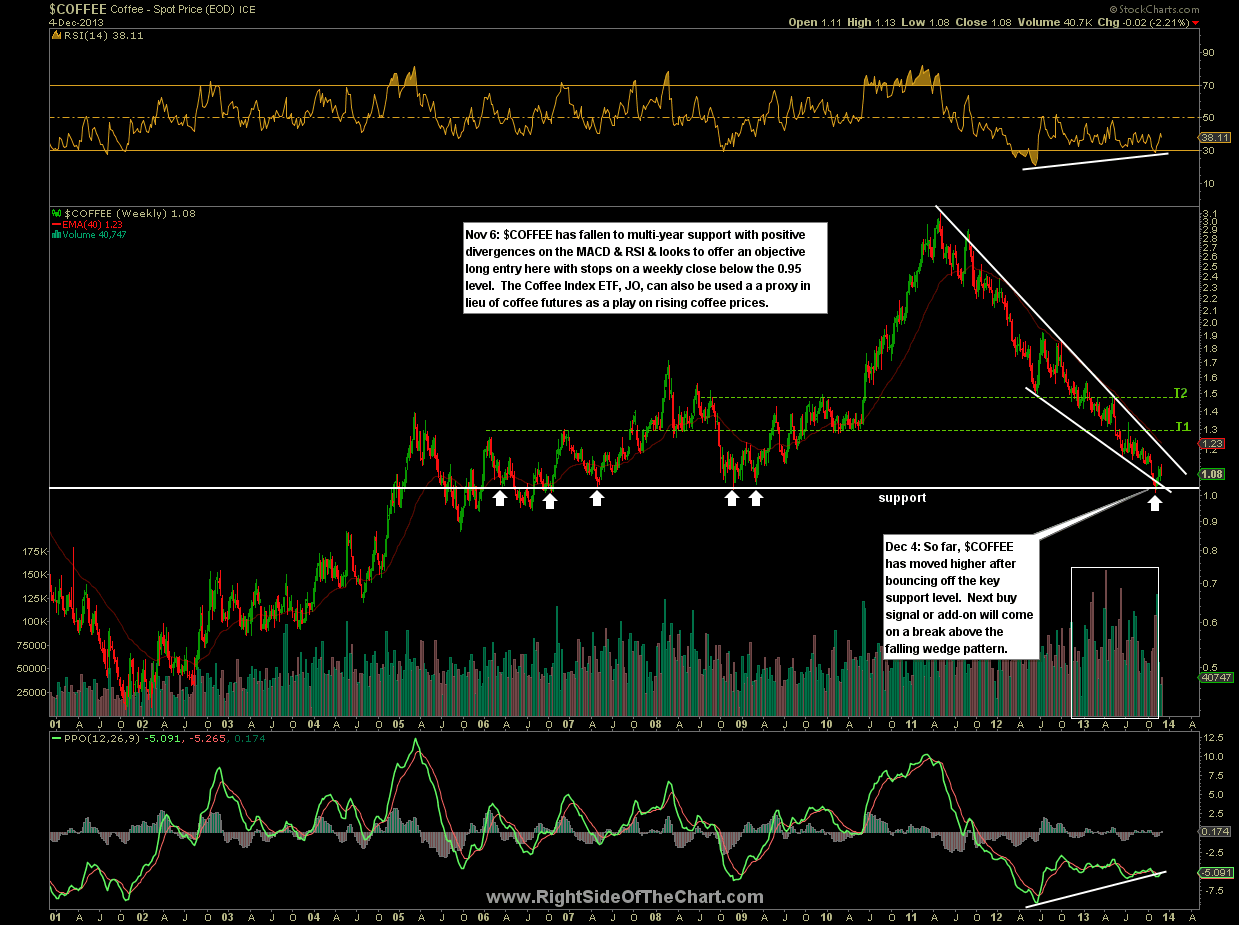
$COFFEE (spot price for coffee) is another current Active Long Trade idea along with the coffee index tracking etf, JO. So far $COFFEE has moved higher after tagging the multi-year support level first highlighted nearly a month ago… a bullish sign so far. The JO (coffee ETF) has already hit its first profit target but could morph into a longer-term swing trade as a breakout above this bullish falling wedge pattern on $COFFEE would likely send prices to the first target level around 1.30 and ultimately toward the second target just below 1.50, gains of roughly 30% & 50% from the original entry price.
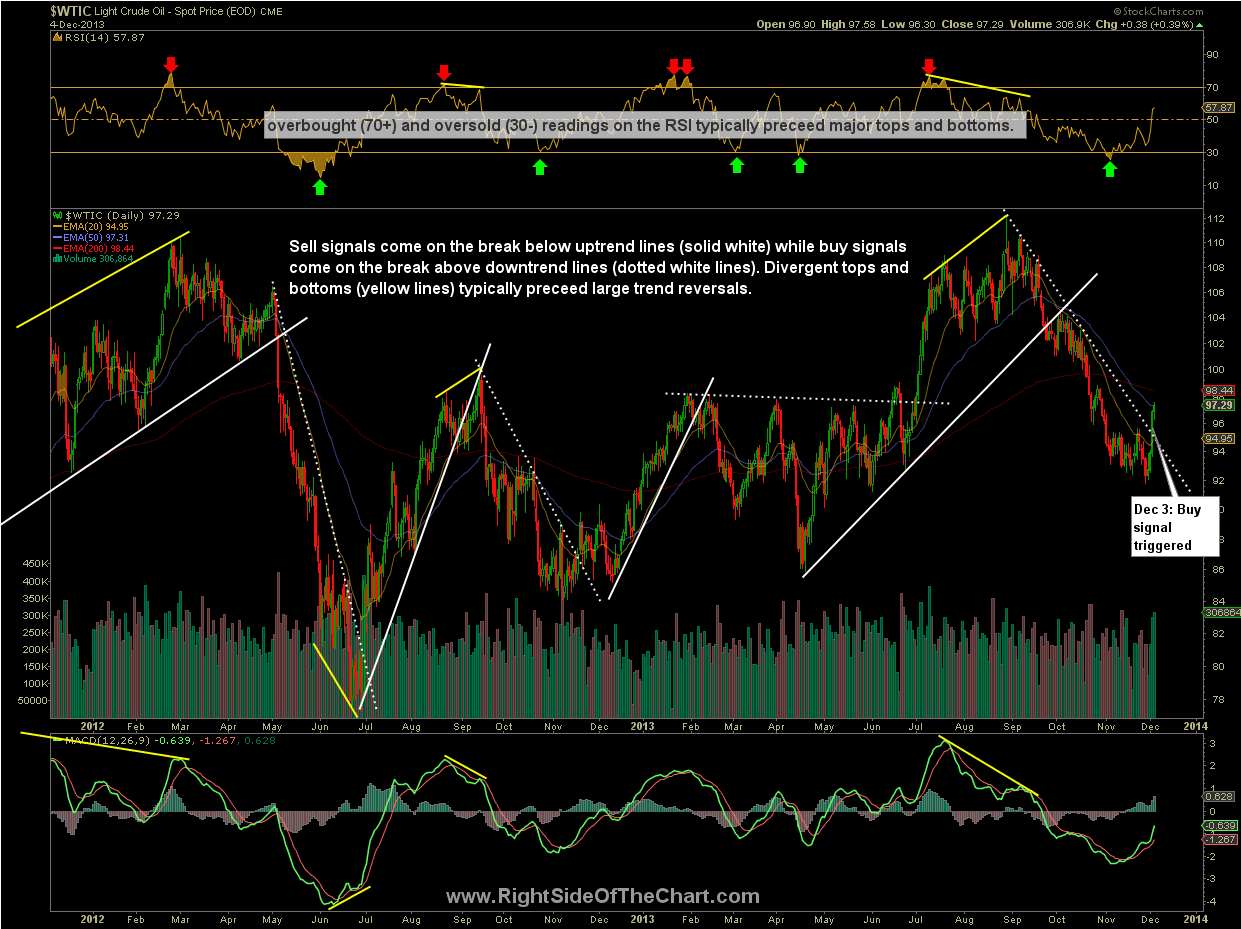
$WTIC (West Texas Intermediate Crude) triggered a buy signal yesterday on a break above the most recent downtrend line. As has been previously noted in the $WTIC live chart, primary downtrend line breaks that are preceded by oversold readings of 30 or lower on the RSI often come at the beginning of major trend changes. For those preferring to trade ETFs over crude futures, USO or OIL are two alternatives (USO being the more liquid/actively traded of the two). My first price target on USO would be around the 36.40 area.
Finally a quick look a $GOLD (spot gold price). I haven’t commented on gold, silver or the mining stocks much lately because my opinion has not been very strong. However, in my last update back on Oct 14, I stated my primary scenario for $GOLD would be a continued move lower in the metal until prices reached the primary uptrend line, which would most likely occur with prices making a roughly equal or marginally new low while also forming strong bullish divergences. As gold has fallen about 30 points since then and is now within close proximity of that downside target, that would still be my preferred scenario. As such, a longer-term investor might continue to scale into select gold, silver and/or mining stocks with stops set in place should gold make a solid breakdown below that key support level.
Links to the live, annotated versions of all of these charts are available under the Live Chart Links page, along with numerous other live, annotated charts including various US & global stock indices, sector ETF charts, and more.


