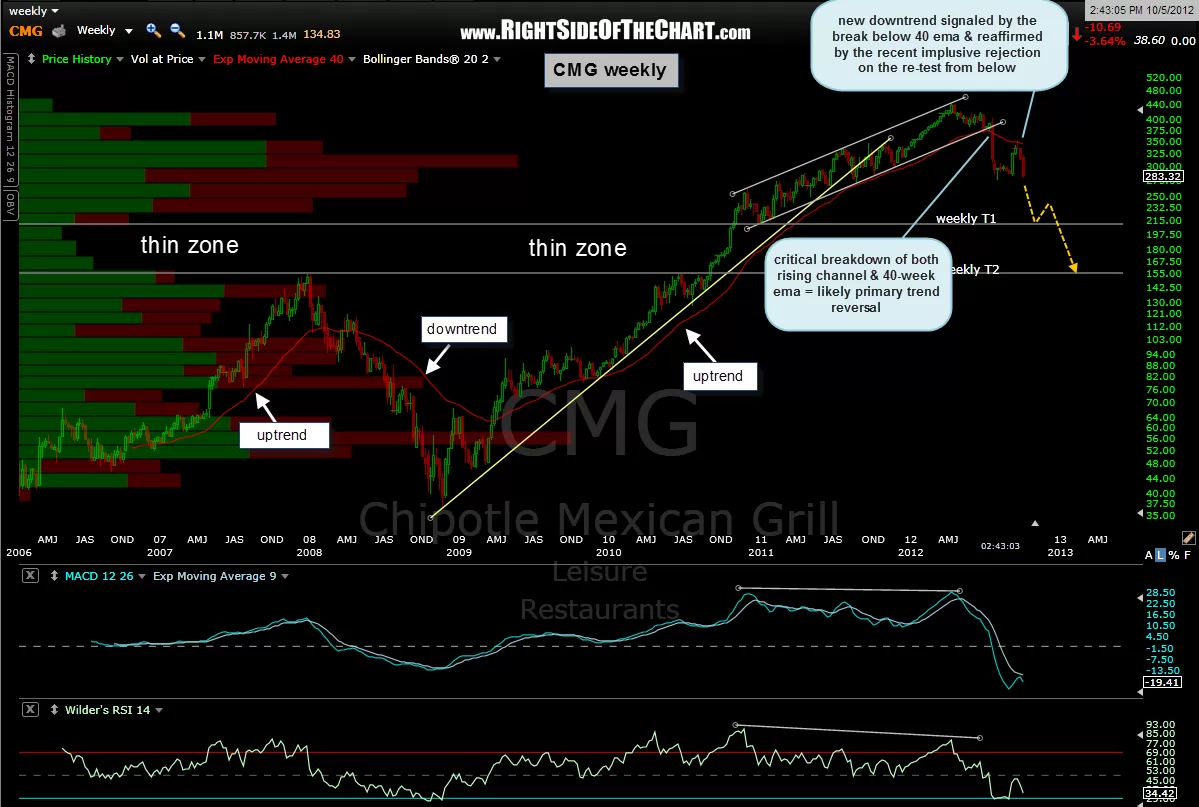
just to clarify, i currently favor T3 on the daily time frame (which is T1 on the weekly frame) for now but for those longer-term swing traders looking to calculate the R/R on the trade in order to determine their stop level(s), i do believe that this trade has a good chance of ultimately hitting T2 on the weekly chart, assuming the broad markets play out as expected. of course, keep in mind that stock price forecasting, whether using fundamental analysis and technical analysis, is just like weather forecasting: the further out we try to predict, the less accurate that prediction is likely to be. the primary reason for that is that the stock market, like the weather, is affected by a nearly infinite number of variables and is therefore dynamic and not static. as the near-term dynamics change, or deviate from the expected, the longer-term forecast must be adjusted accordingly.
for example; regarding the CMG trade, i still believe that the T3 daily (T1 weekly) target has the highest probability of being hit, as i have for months now, regardless of what the broad market does. however, it is just too early to say with a high degree of confidence at this time that the weekly 2nd target will be hit. assuming this trade continues to play out as expected, then i will be able to reassess the technicals and other variables on both CMG and the broad market as the stock approached the next target in order to determine if the primary downtrend is likely to continue or reverse.
finally, just a reminder about how the gains on short trades are calculated and reported on this site. i am still working on the tracking spreadsheet to report the gains and losses of all trades posted here, grouped by month. for now, i do show some of the recent winners on the right-hand side but those are only highlighted trades. all completed trades, winners and losers, can be accessed by scrolling down the posts in Completed Trades section of the site. for tracking purposes, i choose the “honest” calculation when computing gains.
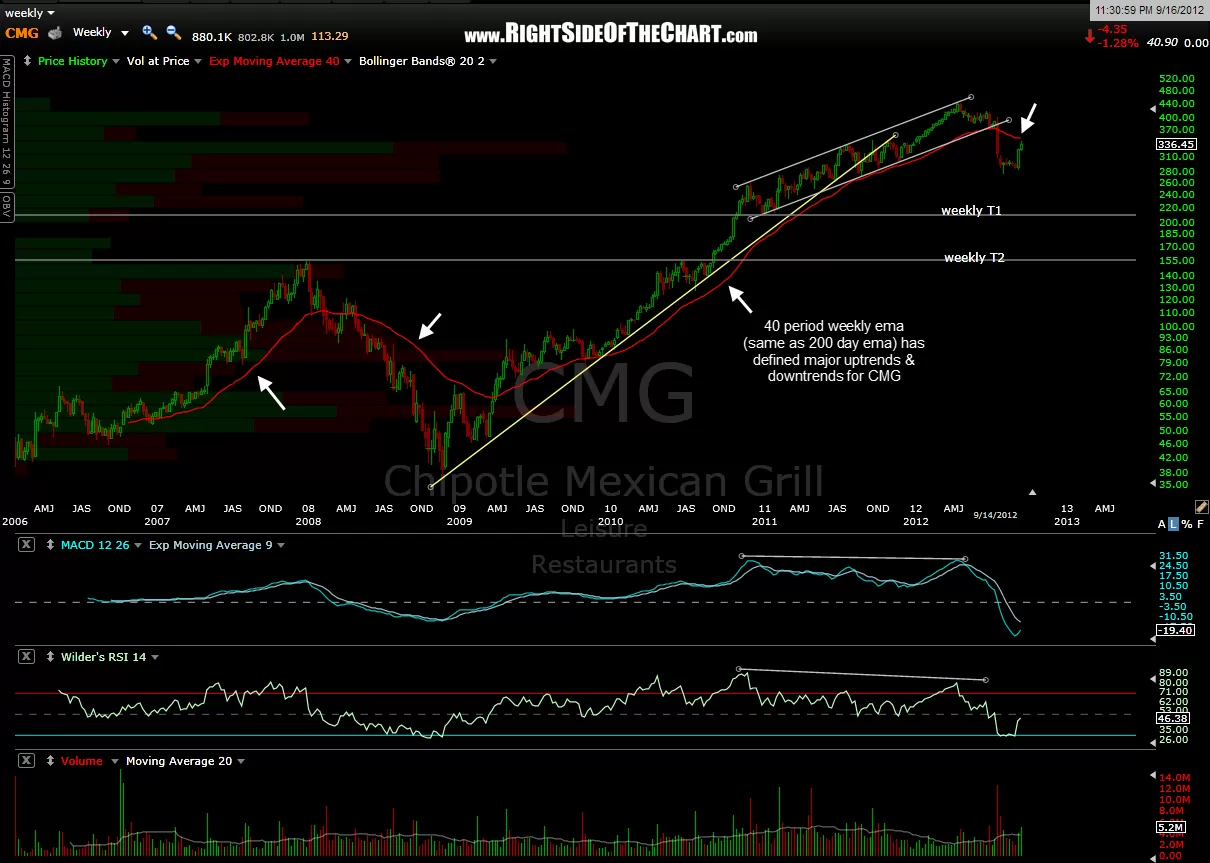
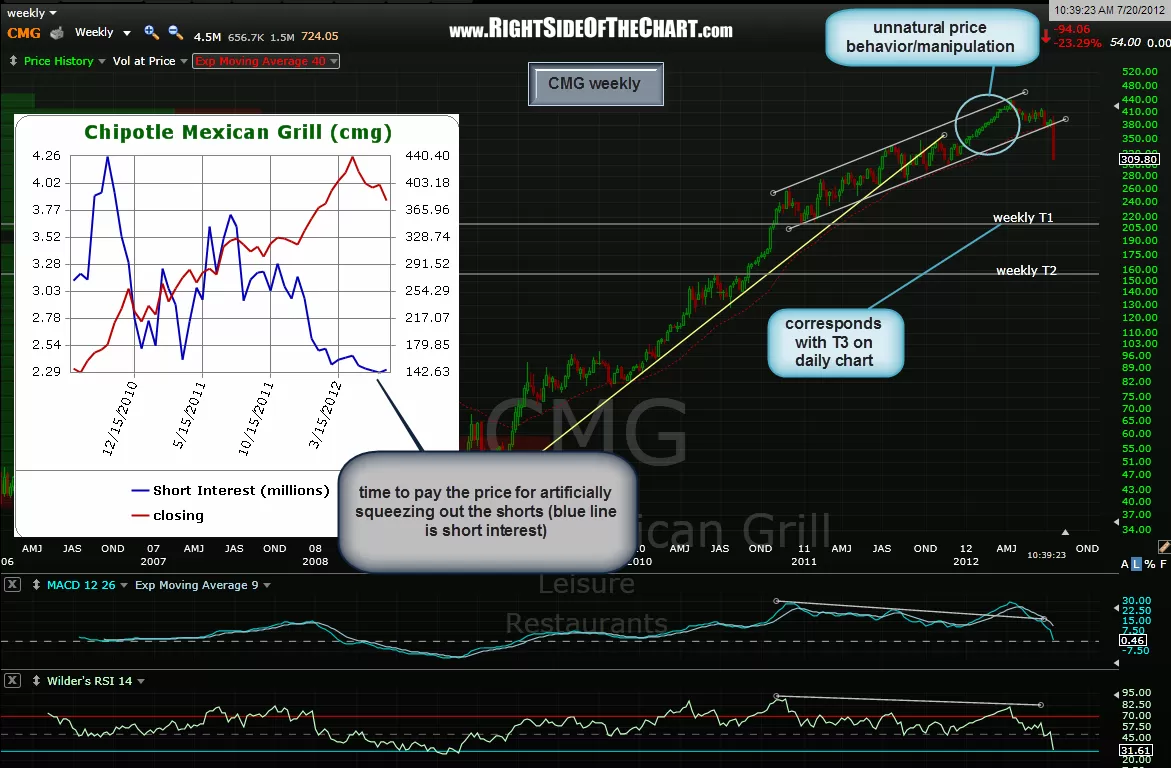
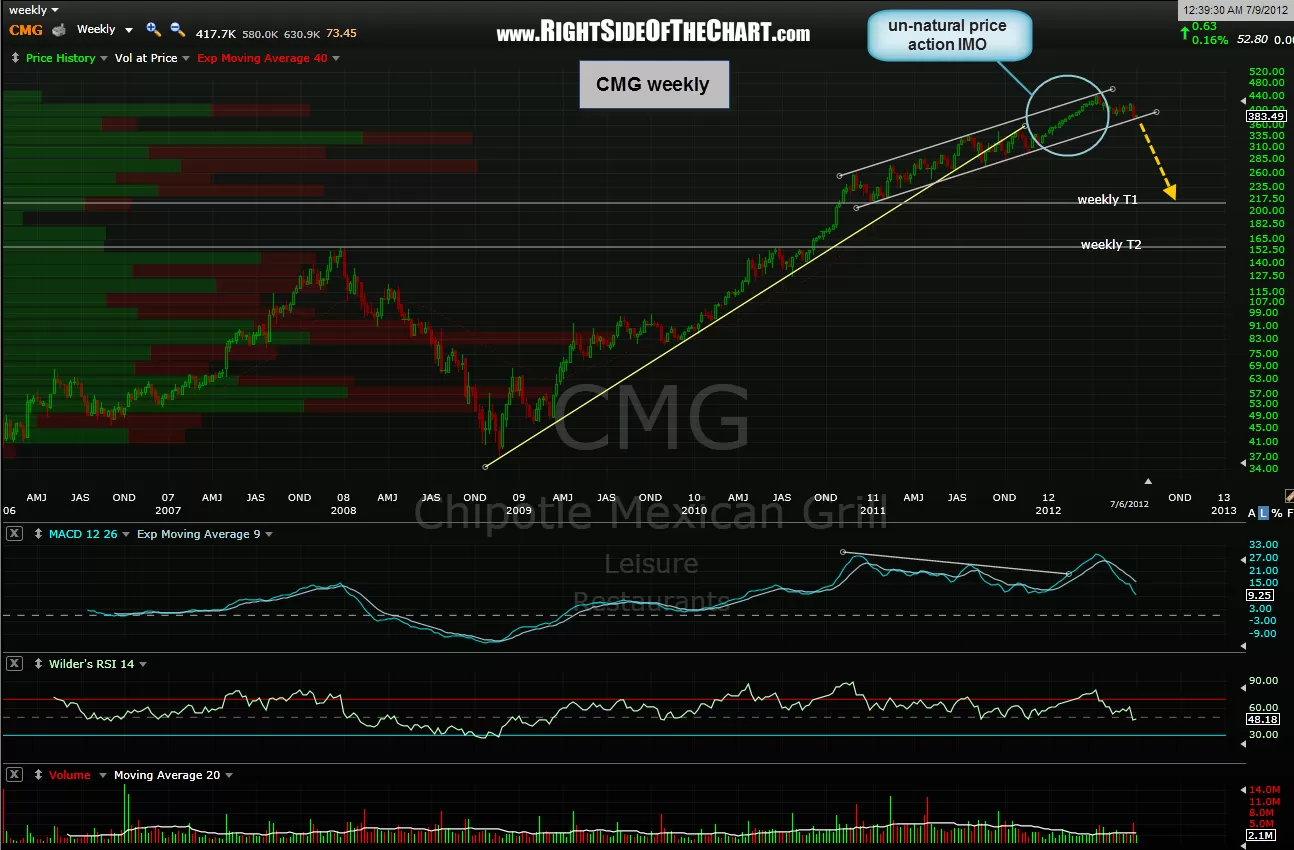
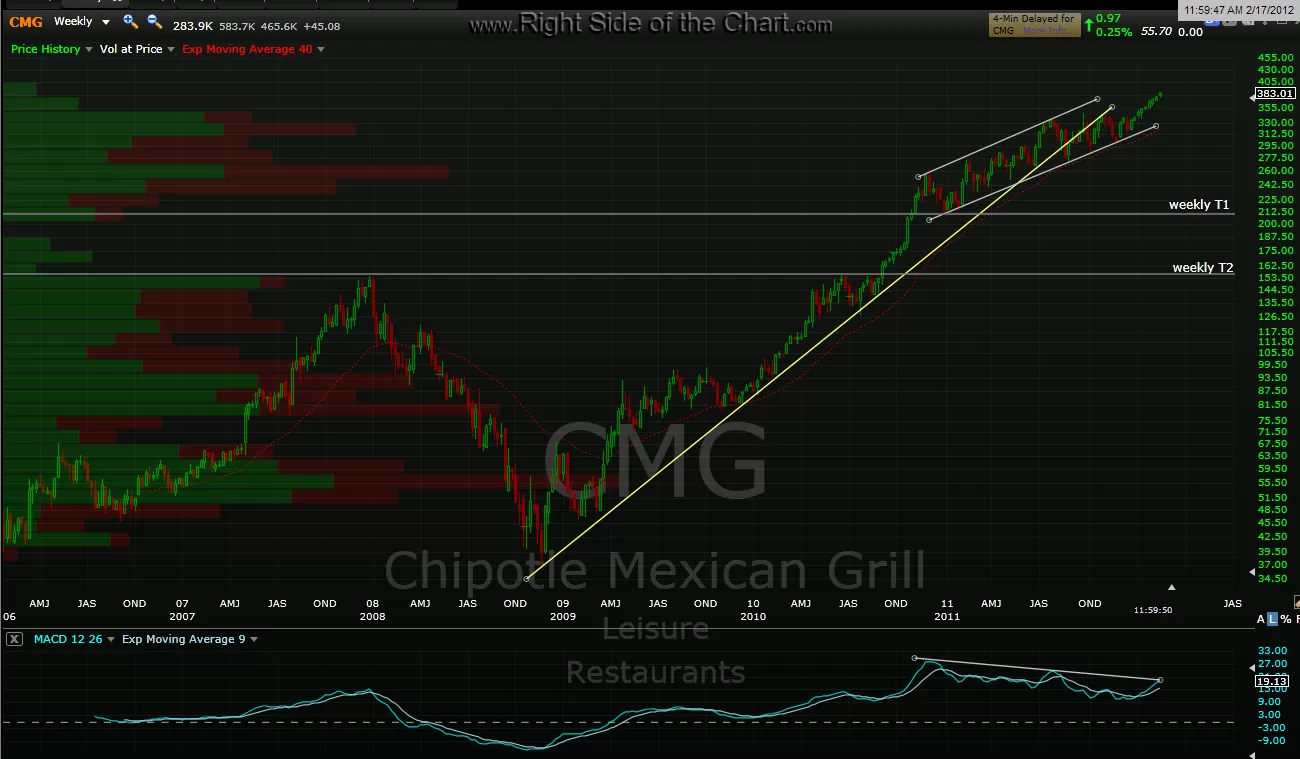
for example: the original entry on the current CMG short was on the breakdown of the uptrend line shown on the 4-hour period chart first posted back on april 16th (and triggered on april 20th at 426 on a break below that TL). coincidentally, this real-world example works well. if CMG hits the current preferred target (T3 daily/T1 weekly), which is at 212, that will be a gain of 50.2%. however, technically speaking, you sold (shorted) the stock at 426 and bought (covered) at 212, so why isn’t this a 100% gain if you “sold” at a price that was double from where you “bought” it? for a detailed explanation, please click here and read the 2nd paragraph of this previous post in which i explain the calculation. CMG weekly charts below are in order as posted with the today’s updated chart last.